Telegraf as a Quix data source
Telegraf is an agent that collects and sends metrics and events from databases, systems, and IoT sensors, to configured outputs. One such output is Quix. This guide shows you how to configure Telegraf to send data of interest to a Quix topic.
Prerequisites
This guide assumes you have the following:
- A Quix Cloud account.
Don't have one?
Contact us to get an account.
We will create a time-limited free account for you, and our experts will help you get started with your specific use case.
You also need to create a project with an environment.
Deploy the Telegraf connector
In order to familarise you with the Quix Telegraf connector you will first deploy the connector to your Quix Cloud project, observe the data produced by the connector and later you can configure your own Telegraf nodes to publish data to Quix.
-
Log In
- Ensure you're logged in to your Quix Cloud account.
-
Telegraf Connector
- Click
Connectorson the nav and locate the Telegraf connector. - Click
Set up connectoron the "Telegraf source" tile. - Provide the name for the output topic, which is where the data will be published.
- Click
Customise connector, this will save a copy of the files to your project. - You can now edit the
telegraf.conffile to add more inputs, and see how the Quix output is configured. - When you are happy with the configuration, you can deploy the service.
- Click
View the data
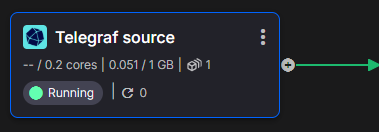
The Telegraf connector you just deployed is now collecting CPU, memory and disk usage from the services deployed in your project. The Telegraf connector may be the only service you have deployed in which case all the data will relate to it.
At this point you should be on the pipeline view, the "Telegraf source" tile will have a line on the right hand side. This line represents a Kafka topic, which is where the Telegraf data is being delivered.
Inspect the data
- Click the topic (the line), it might be green or grey.
- Wait for data rows to be displayed then click a row.
- On the right you will see the data in JSON format. This includes fields and tags as well as the
namee.g. "disk".
Next steps
You now know how to deploy the Telegraf data source to Quix Cloud and how to view the data being produced.
Next you can:
- Create a service to make use of the data. An example is given below.
- Configure your existing Telegraf to send data to Quix Cloud.
Handle the data
You can handle the Telegraf data with code similar to this:
import os
from quixstreams import Application
from datetime import timedelta

from dotenv import load_dotenv
load_dotenv()

app = Application(consumer_group="transformation-v1", auto_offset_reset="earliest")

input_topic = app.topic(os.environ["input"])
output_topic = app.topic(os.environ["output"])

sdf = app.dataframe(input_topic)

sdf = sdf[sdf["name"] == "cpu"]
sdf = sdf.group_by(lambda row: row["tags"]["host"], "group_by_host")
sdf = sdf.apply(lambda row: row["fields"]["usage_system"] + row["fields"]["usage_user"])
sdf = sdf.tumbling_window(timedelta(minutes=1), timedelta(seconds=5)).sum().final()
sdf = sdf.apply(lambda row, key, *_: {
    "time": row["start"],
    "cpu_total": row["value"],
    "tags": {
        "host": key
    }
}, metadata=True)

sdf.print()

sdf.to_topic(output_topic)

if __name__ == "__main__":
    app.run()
This code uses the Quix Python library Quix streams to:
- Filter the data to include only rows with a name field equal to "cpu".
- Group the data by host.
- Calculate the total CPU usage from the system and user based usage.
- Create a 1 minute tumbling window of the total CPU usage in the window.
- Reformat the data for output to another Kafka topic to be consumed by a downstream process.
To deploy this code to Quix Cloud, use the Starter Transformation from the templates and replace the code with this.
Configure your existing Telegraf
You can configure your existing Telegraf 1.3.3+ nodes to transmit data to Quix Cloud.
Continue reading to learn how to add the Quix Telegraf Output to an existing Telegraf config to start sending data to Quix.
Get Telegraf 1.3.3+
If you don't have Telegraf 1.3.3 (or newer) you can get started by following the guide here.
Note that the guide may not direct you to install the latest version, just make sure youre installing at least 1.3.3
Telegraf Configuration
The default configuration for our Telegraf sample is shown here.
We have included some basic settings for the agent and some inputs like CPU and disk.
We have also included outputs.quix, a new Telegraf plugin allowing users to transmit their Telegraf data to a Quix Cloud account.
See below for how to configure the plugin.
# Global Agent Configuration
[agent]
  interval = "10s"
  round_interval = true
  metric_batch_size = 1000
  metric_buffer_limit = 10000
  collection_jitter = "0s"
  flush_interval = "1s"
  flush_jitter = "0s"
  precision = ""
  debug = false
  quiet = false
  logfile = ""

[[inputs.cpu]]
  percpu = true
  totalcpu = true
  collect_cpu_time = false
  report_active = false

[[inputs.mem]]
  ## Collect memory usage metrics

[[inputs.disk]]
  ## Collect disk usage metrics
  ignore_fs = ["tmpfs", "devtmpfs"]

[[outputs.quix]]
  workspace = "${Quix__Workspace__Id}"
  auth_token = "${Quix__Sdk__Token}"
  api_url = "${Quix__Portal__Api}"
  topic = "${output}"
  data_format = "json"
  timestamp_units = "1ns"
Details about these Telegraf plugins can be found in the Telegraf plugin directory, however these are the basic details:
-
Determines collection parameters including the collection interval, batch sizes and buffer limits.
-
Adds and configures collection of CPU usage metrics from the deployed and background services.
-
Adds and configures collection of memory usage metrics from the deployed and background services.
-
Adds and configures collection of disk usage metrics from the deployed services.
-
Adds and configures output of collected data to a Quix project.
By default, each of the required configuration values is pre-configured and supplied with values from the Quix environment variables.
If you want to use the Quix Output from your existing Telegraf installation you will need to supply the following values:
Workspace Id- Go to "Environment Settings" in Quix and copy the Workspace ID which is now called "Environment ID".Authentication Token- read: how to get a streaming tokenAPI Url- Go to "Settings" "API and tokens" and copy the "Portal API swagger" URL. You only need the first part of the URL. e.g. https://portal-api.X.quix.io/ (replace X to match your URL)Topic- Ensure you have a topic in the Quix Cloud UI, navigate to the topics page and copy the "Topic ID".
Next steps
- Learn how to build a complete Python stream processing pipeline
- Try one of our tutorials
- Obtain an InfluxDB account
- Read the comprehensive Telegraf documentation