Alert service
Sends alerts to an output topic when the temperature is under or over the threshold.
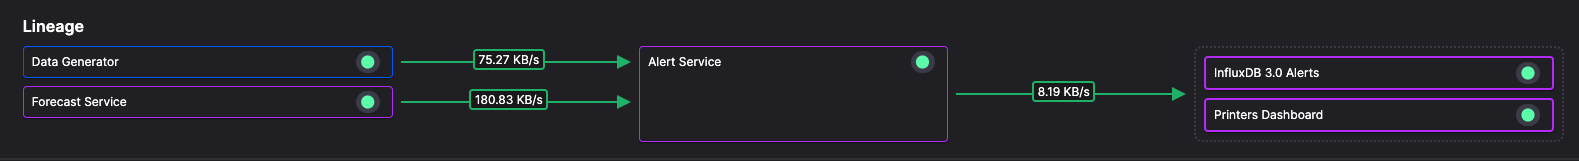
It receives data from two topics (3d printer data and forecast) and triggers an alert (to output topic alerts) if the temperature is under or over the threshold.
The default thresholds are as shown in the following table:
| Variable | Default value (degrees C) |
|---|---|
| min_ambient_temperature | 45 |
| max_ambient_temperature | 55 |
| min_bed_temperature | 105 |
| max_bed_temperature | 115 |
| min_hotend_temperature | 245 |
| max_hotend_temperature | 255 |
These thresholds are used to determine if the temperature, or forecast temperature, are under or over the threshold values. If so these alerts are published to the json-alerts topic.
Note there are different alert types, with the message format for the no-alert type alert:
{
  "status": "no-alert",
  "parameter_name": "hotend_temperature",
  "message": "'Hotend temperature' is within normal parameters",
  "timestamp": 1701280033000000000,
  "alert_temperature": 246.04148121958596
}
An example of the under-now alert message format:
{
  "status": "under-now",
  "parameter_name": "bed_temperature",
  "timestamp": 1701273328000000000,
  "alert_temperature": 104.0852349596566,
  "message": "'Bed temperature' is under the threshold (105ºC)"
}
Here's an over-forecast alert message format:
{
  "status": "over-forecast",
  "parameter_name": "forecast_fluctuated_ambient_temperature",
  "alert_temperature": 55.014602460947586,
  "timestamp": 1701278280000000000,
  "message": "'Ambient temperature' is forecasted to go over 55ºC in 1:36:29."
}
Here's the under-forecast alert message format:
{
  "status": "under-forecast",
  "parameter_name": "forecast_fluctuated_ambient_temperature",
  "alert_temperature": 44.98135836928914,
  "timestamp": 1701277320000000000,
  "message": "'Ambient temperature' is forecasted to fall below 45ºC in 1:20:28."
}
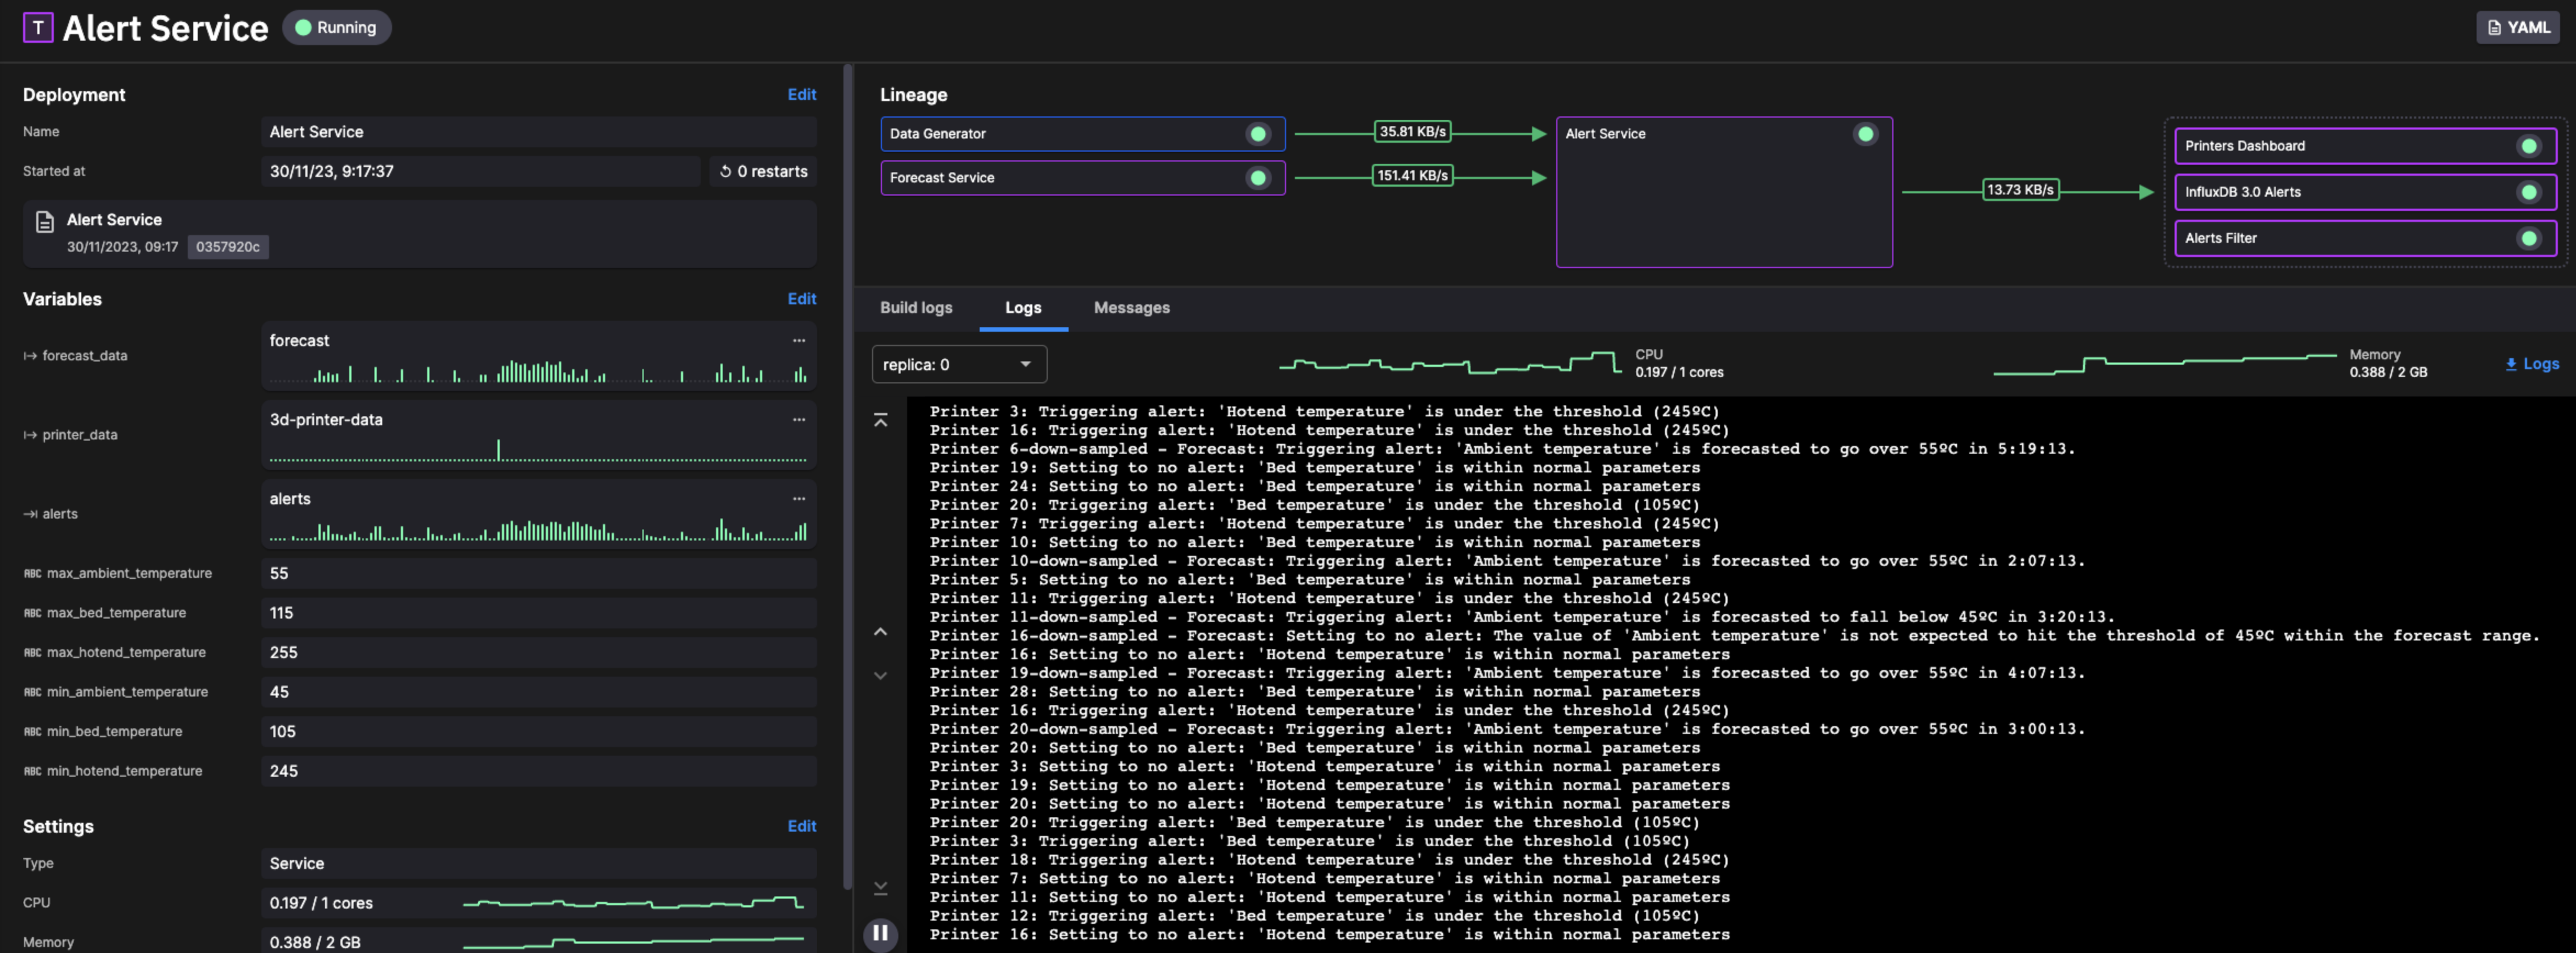
Check the log messages
It can be very useful to check the logs for a service. To do this from the pipeline view:
-
Click on Alert Service in the pipeline view.
-
Click the
Logstab.
You can now view the log messages:
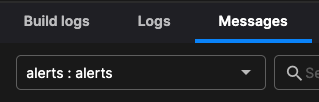
View the message format
You can also view the actual messages being transferred through the service:
-
Click the
Messagestab. -
You can now select either the input or oputput topic as required from the topic drop down:
-
You can now explore the messages. Click on a message to display it:
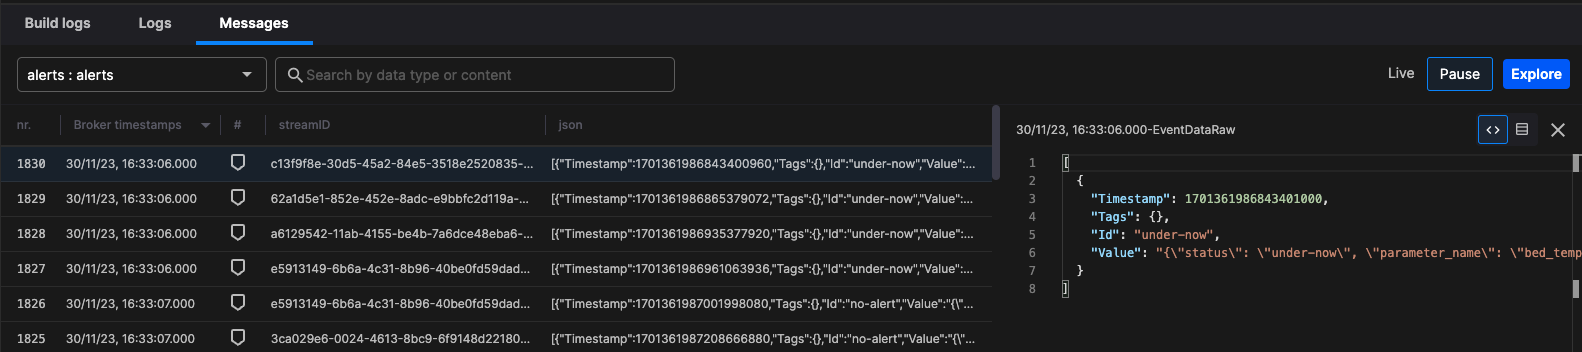
Make sure you click the Live tab to continue viewing live messages.