Quickstart
This quickstart shows you how to integrate Quix with InfluxDB using our standard connectors.
In the first part of this quickstart, you'll read F1 car telemetry data, transform it, and then publish it to InfluxDB.
In the second part you'll get data from InfluxDB and publish it into a Quix topic, explore that data in real time.
This demonstrates various aspects of building a typical ETL processing pipeline, where you extract data, transform it in some way, and then save it to a database.
This quickstart demonstrates both saving data to InfluxDB and querying data from InfluxDB, using Quix standard connectors, and Quix Streams.
Prerequisites
To complete this quickstart you will need:
- A Quix Cloud account.
Start for free
Book a session with us to start for free.
We will create a time-limited free account for you, and our experts will help you get started with your specific use case.
- An InfluxDB account.
You also need to create a project with an environment, or simply use your default environment.
Create your InfluxDB bucket
Log into your InfluxDB account and create a new bucket called f1-data.
Obtain your InfluxDB token
In the InfluxDB token manager, generate an API token for this project.
An "all access" token can be created. Also provide a useful description such as "Quix Quickstart F1 Data". Save the token securely for later use.
Create your demo data source in Quix
You now need to create a sample data source in Quix, so you have some data to store in InfluxDB.
Assuming you have created your project and environment, you can add a sample data source as follows:
-
In the pipeline view of your environment, click
+ Sample data source. -
Click
DeployandDeployagain to add the sample data source into your pipeline.
Alternatively, click Add new (top right corner in pipeline view), select Source, and then select Demo Data. You can then deploy this sample.
By default, the output topic from this sample is f1-data.
Add a transformation
You'll now add a simple transformation to your pipeline.
-
Switch to the pipeline view and click
+ Add newand selectTransform. -
In the filters select
Python,Transformation, andBasic Templates. -
Click
Preview codeforStarter transformation. This is the starter tranformation using Quix Streams. -
Click
Edit code, and thenSaveto save the application to your repository. -
Edit the environment variables so that the input topic is
f1-data, and the output topic isprocessed-telemetry. Theprocessed-telemetrytopic needs to be created. You can use theAdd newbutton in theEdit variabledialog to do this.Modify the
main.pycode of the transformation to the following:import os from quixstreams import Application from datetime import timedelta # for local dev, load env vars from a .env file from dotenv import load_dotenv load_dotenv() # create a Quix Streams application app = Application() # JSON deserializers/serializers used by default input_topic = app.topic(os.environ["input"]) output_topic = app.topic(os.environ["output"]) # consume from input topic sdf = app.dataframe(input_topic) # calculate average speed using 15 second tumbling window sdf = sdf.apply(lambda row: row["Speed"]) \ .tumbling_window(timedelta(seconds=15)).mean().final() \ .apply(lambda value: { 'average-speed': value['value'], 'time': value['end'] }) # print every row sdf = sdf.update(lambda row: print(row)) # publish to output topic sdf = sdf.to_topic(output_topic) if __name__ == "__main__": app.run(sdf)This transform calculates the average speed of the F1 car using a 15 second tumbling window and writes this data to the output topic.
-
Click
Deployto deploy your transformation.
Make sure the deployed service starts and is running correctly.
Add your InfluxDB destination
You can now add an InfluxDB destination to enable you to publish data from a Quix topic to InfluxDB.
-
Switch to the pipeline view and click
+ Add newand selectDestination. -
In the search box type "Influx" and click
Preview codeon the InfluxDB 3.0 connector. Take a note of the environment variables you'll need to set and then click theEdit codebutton. -
Leave the default Application name and Path and click
Saveto save to your repository. -
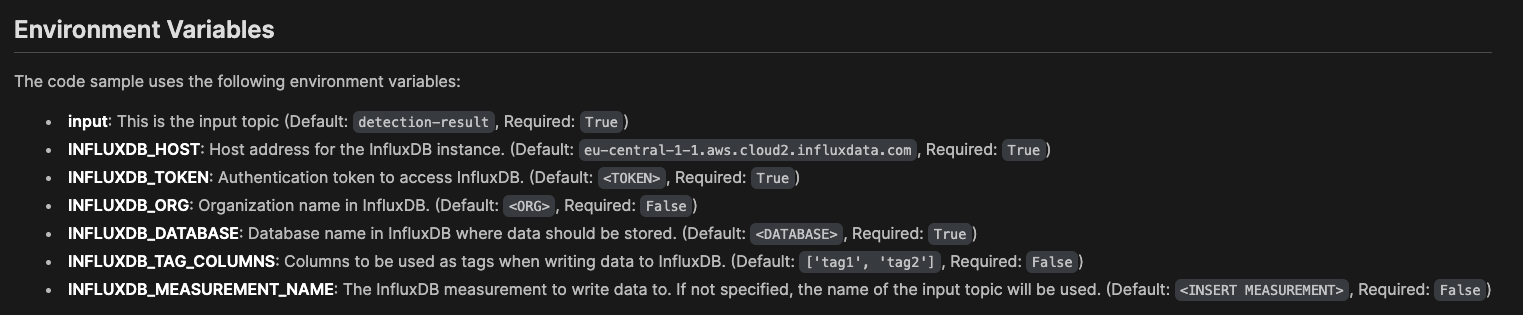
You now need to configure the required environment variables:
Tip
This table shows some example values:
Variable Description inputThis should be set to processed-telemetry, if not already set.INFLUXDB_HOSTYour Influx host. Example: https://us-east-1-1.aws.cloud2.influxdata.com/INFLUXDB_TOKENYour all-access token generated in Influx. This variable needs to be of type secret, so your token is not revealed. Example:z7E<snip>Og==INFLUXDB_ORGIn your Influx account you can see your available organizations. Example: DocsINFLUXDB_DATABASEThe InfluxDB bucket, in this case f1-dataINFLUXDB_TAG_COLUMNSLeave as default, ['tag1', 'tag2'].INFLUXDB_FIELD_KEYSEnter ['average-speed']. This is an array of the fields from the inbound message you want to write to the database.INFLUXDB_MEASUREMENT_NAMEThe "table" name, in this case f1-data.CONSUMER_GROUP_NAMEConsumer group name, for example influxdb-sink.TIMESTAMP_COLUMNThis is the field in your data that represents the timestamp in nanoseconds. If you leave this blank, the message timestamp received from the broker is used. Case sensitive. Optional. -
Click the
Runbutton to test connection with the database. If no errors occur, proceed to the next step, or otherwise check you have configured your environment variables correctly. -
Click
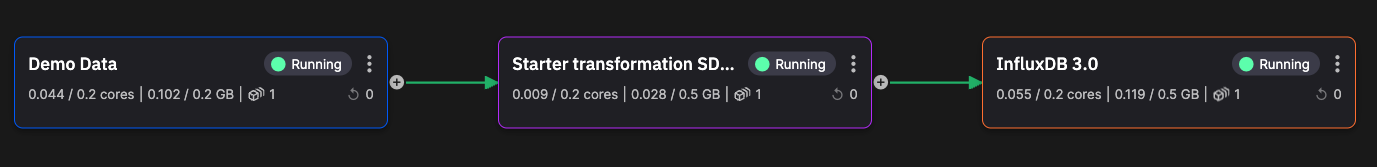
Deployand leave the settings at their defaults to build and deploy your InfluxDB connector. The database will then start receiving data once the build completes.
The pipeline now looks like the following:
Check your data in InfluxDB
You will now check that your InfluxDB database is receiving data.
-
In InfluxDB switch to the Explorer and in the schema browser select the
f1-databucket. -
Under
Measurementselectf1-dataand clickRun. You see the data stored in InfluxDB.
You have successfully processed F1 car telemetry data and published it from Quix to InfluxDB.
Note
In the next part of this quickstart you learn how to retrieve data from InfluxDB and publish it to Quix.
Add an InfluxDB source
You now add an InfluxDB source to enable you to query data from InfluxDB and publish it to a Quix topic.
-
In the pipeline view, in the top right click the
Add newbutton and then selectSource. -
Type "Influx" into the search bar and click
Preview codefor the InfluxDB 3.0 connector. -
Click
Edit codeand accept the defaults for Application name and path. -
You now need to configure environment variables, in the same way as you did previously for the destination connector.
Important
For the default output topic,
influxdb, you need to make sure that topic is created. You can do this once you click edit variable. Accept the defaults in theNew topicdialog. Also, the database is the bucket you created previously,f1-data. The measurement is alsof1-data. For convenience, you can set thetask_intervalto1s- this enables data to come through more quickly, as data changed in the last one second is published to the output topic. You can reuse the InfluxDB credentials you set previously. -
Click the
Runbutton to test connection with the database. You will seequery successin the console if the connection is working. If no errors occur proceed to the next step, or otherwise check you have configured your environment variables correctly. -
Click
Deployand leave the settings at their defaults to build and deploy your InfluxDB connector. The connector will then query data from InfluxDB and publish it to the Quix output topic, once the build completes. -
Switch back to the pipeline view.
Explore the data from InfluxDB in real time
You can now explore data queried from InfluxDB and published to the Quix topic influxdb by the connector.
-
In the main left-hand menu, click on
Topics. -
Click the
influxdbtopic. -
You can now see the live messages. Click on a message to display it.
Data is being queried from InfluxDB by the Quix connector, and then published to the Quix topic, influxdb. The Quix live data monitoring is then used to display this data in real time.
Summary
In this quickstart you have learned how to publish data to InfluxDB, and also how to read data from InfluxDB. You also learned the basics of adding a simple transform to your stream processing pipeline.
You also learned how to view the messages in a Quix topic in real time, using the Quix live data monitoring.