.svg)
Industry insights
Aug 5, 2025
Your R&D test rig data is worth more than you think
R&D teams waste millions of test data points by losing configuration context. Learn how to link test data with metadata for faster insights and reproducible res

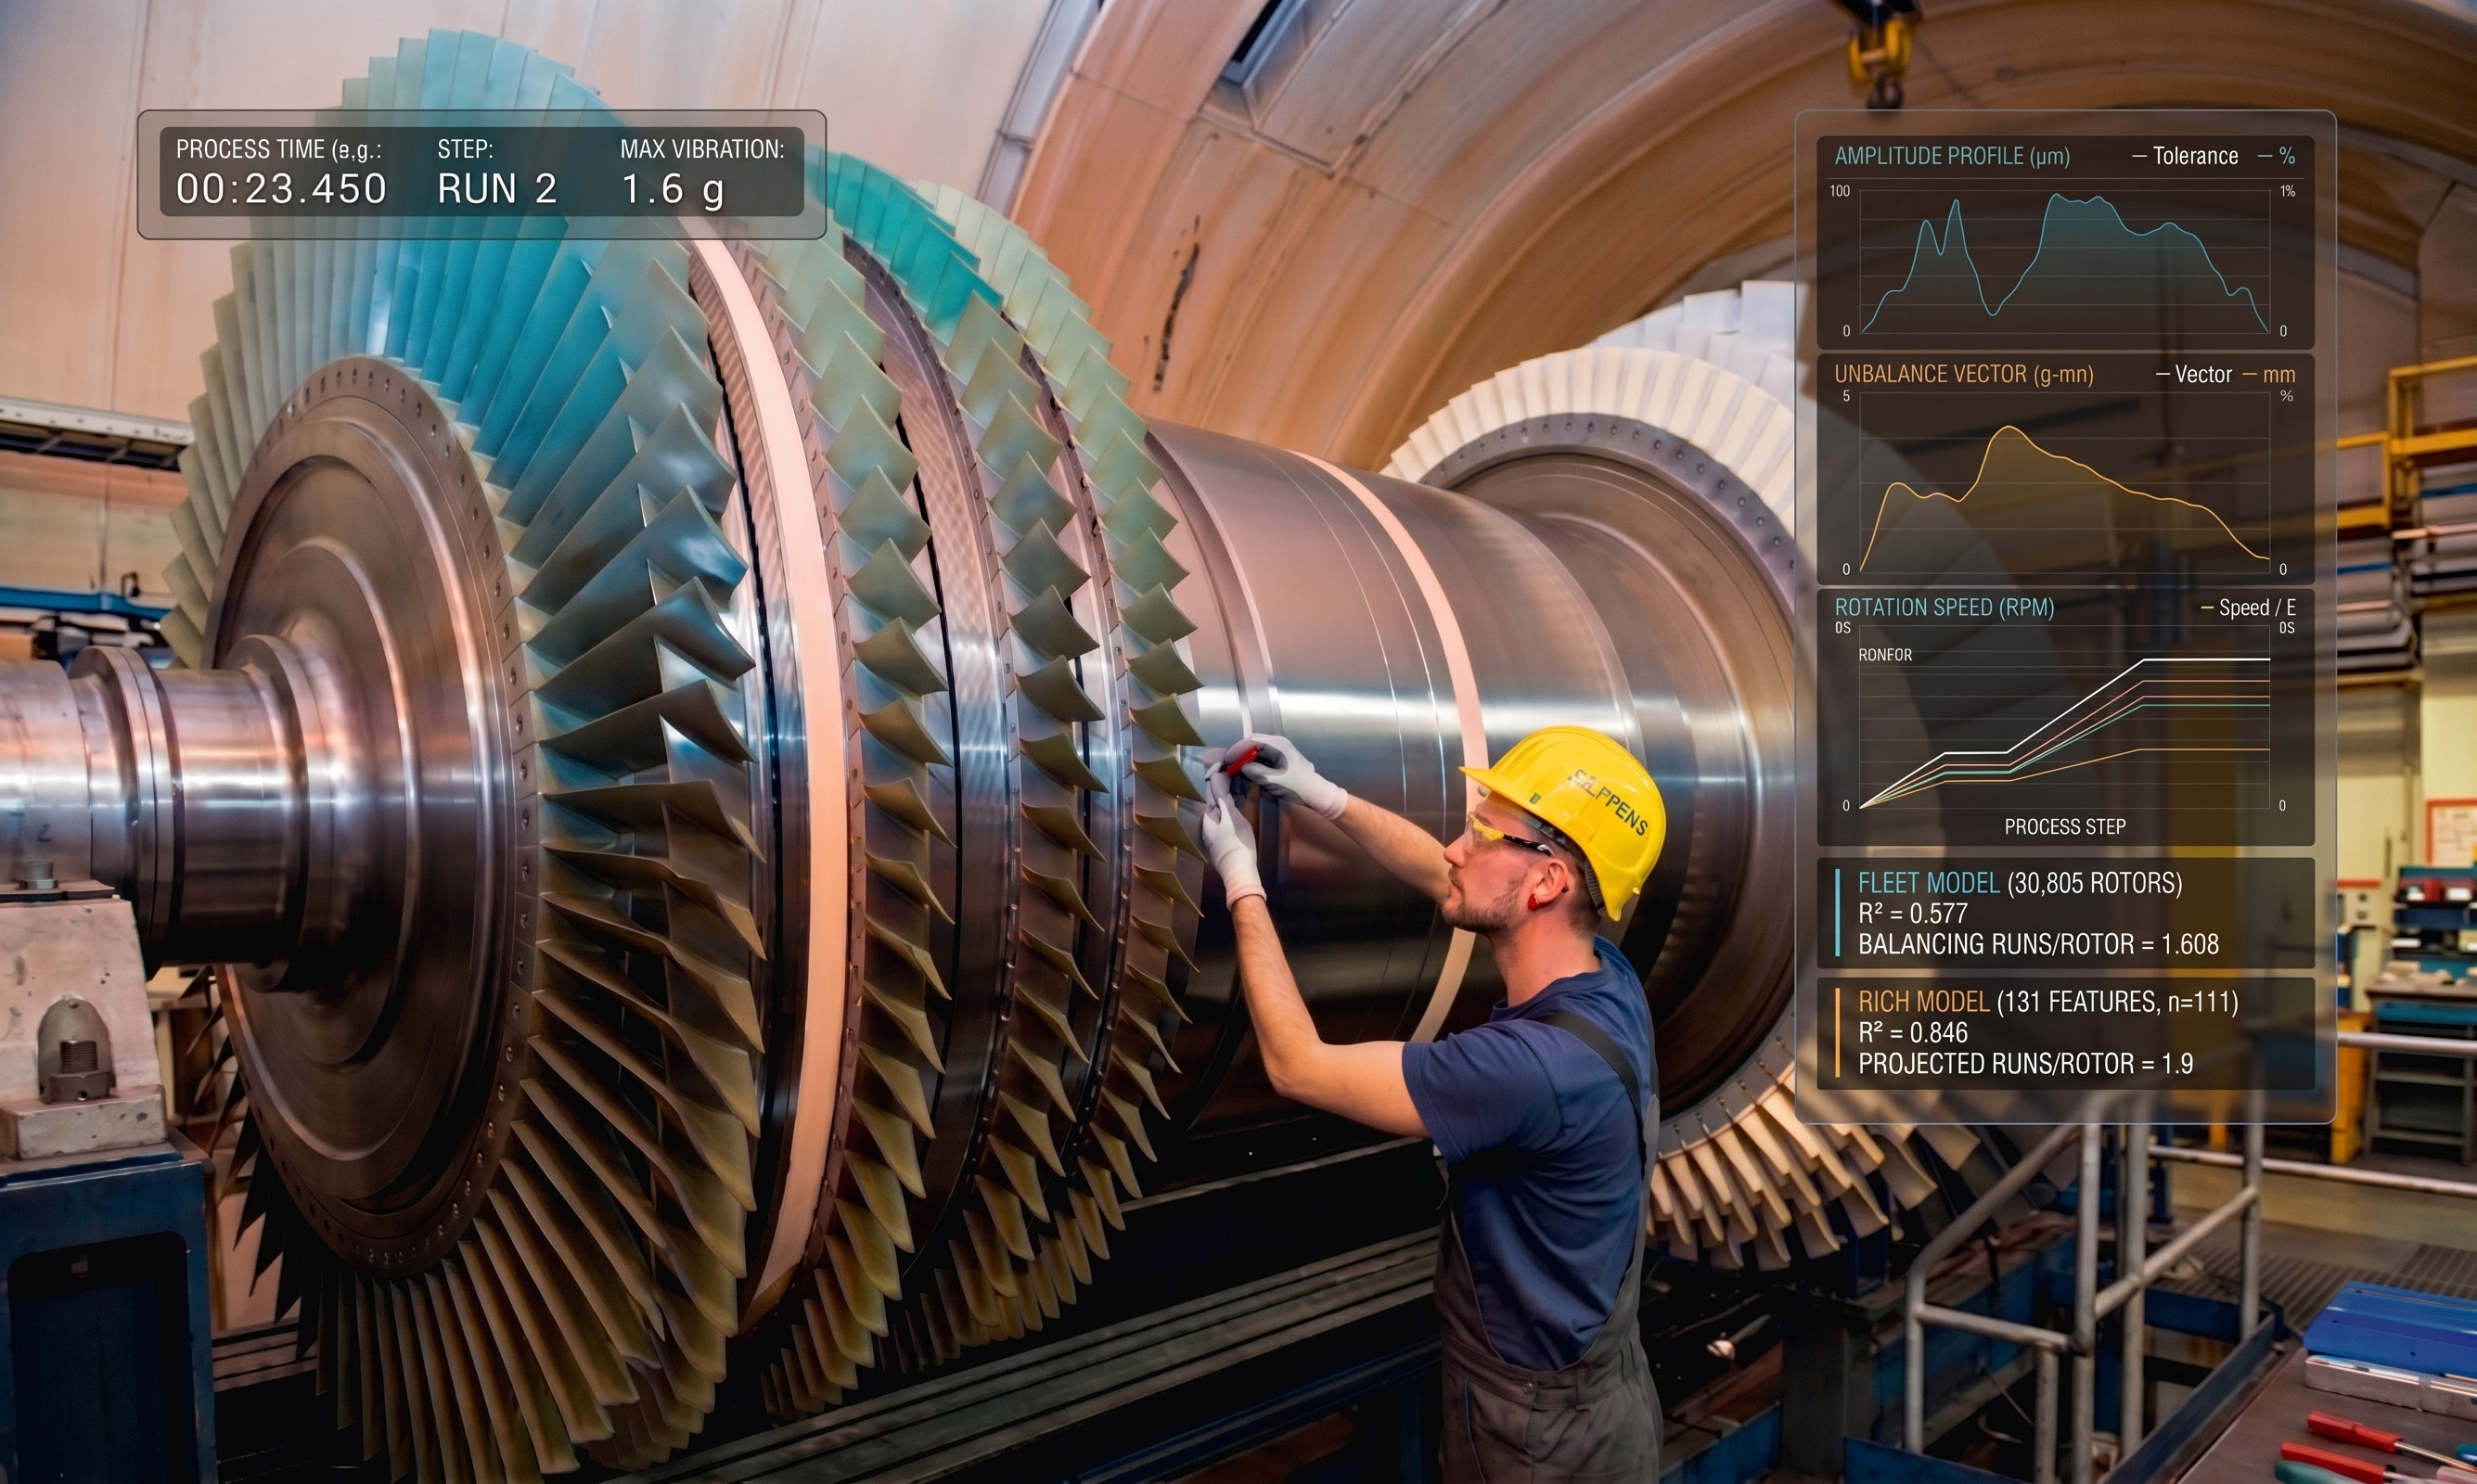
Your test rig just finished a 12-hour endurance run on your latest battery design. Sensors captured temperature, voltage, current, and vibration data at 1,000 Hz. That's over 43 million data points sitting in files somewhere on your network.
But here's what happens next in most R&D teams: the data gets archived, the engineer moves on to the next test or leaves the company entirely, and those 43 million insights slowly fade into digital obscurity.
You're probably throwing away test data
R&D generates massive amounts of test data. A single automotive powertrain test can produce 500 GB per day. Aerospace engine tests routinely capture terabytes across multiple test campaigns. HVAC system validation might generate gigabytes of thermal and airflow measurements.
Most R&D teams treat this data like a byproduct instead of recognizing its real value.
The result? Engineers waste time and resources re-running tests they've already completed. Design decisions get made without the full picture. When senior engineers retire, years of hard-won insights walk out the door with them.
When your test data becomes a liability
Here's a scenario that might sound familiar to many. Your team runs a promising test on a new iteration. Performance looks good, but three months later when you're ready to scale up, nobody can remember the exact parameter settings, which configuration files were used, or the exact model and firmware versions. The test engineer has moved to another project or left the organization. The configuration files are scattered across different folders with inconsistent naming.
You're back to square one. The only option is to start over.
This happens daily in R&D teams across all industries. The problem isn't just storing data - it's connecting the data with the context that makes it meaningful. What motor temperature profile produced the best efficiency? Which control algorithm prevented oscillation in your actuator movement? What specific configuration performed best under those test conditions?
Without configuration metadata tied to your time-series measurements, your test data is just noise.
The configuration context problem
Your test rig captures clean time-series data. Temperature spikes at minute 47. Pressure drops at minute 52. Voltage fluctuates between minutes 78 and 82.
But what configuration was running when the temperature spiked? Was it the aggressive cooling algorithm or the power-saving mode? Which sensor calibration file was active? What version of the control software was deployed?
Most R&D teams store configuration data separately from measurement data. Configuration files live in version control. Test parameters get documented in spreadsheets. Sensor calibrations exist in different systems entirely.
When it's time to analyze results or reproduce a test, engineers spend hours hunting down the right configuration files. Sometimes they never find them.
How this affects your entire R&D organization
This fragmentation creates problems that get worse over time:
Fewer iterations. Engineers can't quickly identify which configuration changes improved performance, so they repeat experiments unnecessarily.
Knowledge transfer issues. When team members leave, their configuration expertise leaves with them. New engineers start from scratch instead of building on previous work.
Compliance headaches. Regulatory audits require complete traceability from test results back to exact configurations. Manual documentation processes introduce errors and gaps.
Poor cross-team collaboration. Simulation teams can't easily validate their models against real test data because configurations don't match up cleanly.
The market is catching up
The global High Speed Data Acquisition System Market is projected to grow from USD 4.5 billion in 2024 to USD 7.7 billion by 2032, with a CAGR of 7.02%¹. This reflects real demand from R&D teams who need better ways to capture and process test data.
Recent hardware improvements like Emerson's expansion of their data acquisition portfolio with the NI cDAQ-9187 and cDAQ-9813 Ethernet chassis focus on modular, multi-channel systems². Real-time analytics are driving growth in the high-speed data acquisition market, letting engineers spot issues during tests rather than hours or days later.
But hardware only addresses half the problem. While these systems excel at capturing high-speed data, the bigger challenge is managing the relationship between your time-series measurements and the configuration context that produced them.
What better R&D data infrastructure looks like
Some R&D teams are moving beyond desktop-based workflows toward centralized data platforms that automatically link configuration metadata with time-series measurements.
Instead of storing test data in isolated files, these systems create a unified view where every data point connects to its configuration context. When an engineer reviews a test run, they can see not just what happened, but exactly which configuration, models, and parameters were active at each moment.
This changes how R&D teams work:
Faster insights: Engineers quickly identify which configuration changes improved performance across multiple test runs.
Reproducible results: Any test can be recreated with confidence because all configuration parameters are preserved and linked to the data.
Better collaboration: Teams share not just results, but the complete context needed to understand and build on those results.
Simpler audit trails: Systems automatically capture the complete chain from configuration to results.
What to do next
Your test rigs already capture valuable data. The question is whether you can actually extract value from it.
Ask yourself: when your team reviews test results, how quickly can they identify the exact configuration that produced those results? If the answer involves hunting through multiple systems, manual documentation, or hoping someone remembers the settings, you're behind your competition.
Modern R&D data infrastructure doesn't just store test data, it preserves the context that makes that data meaningful and actionable. The teams that figure this out first will have an advantage in shortening their design-validation cycles.
The data from your test rigs represents thousands of hours of engineering effort and expensive equipment time. Make sure you're getting the full value from that investment.
References:
¹ Globe Newswire. "High Speed Data Acquisition System Market Outlook Report 2025-2034." July 10, 2025.
² Emerson. "Emerson's New Data Acquisition Solutions Streamline Testing for Entry-Level Ethernet Systems." Press Release, February 2025.
Last updated:
Aug 4, 2025
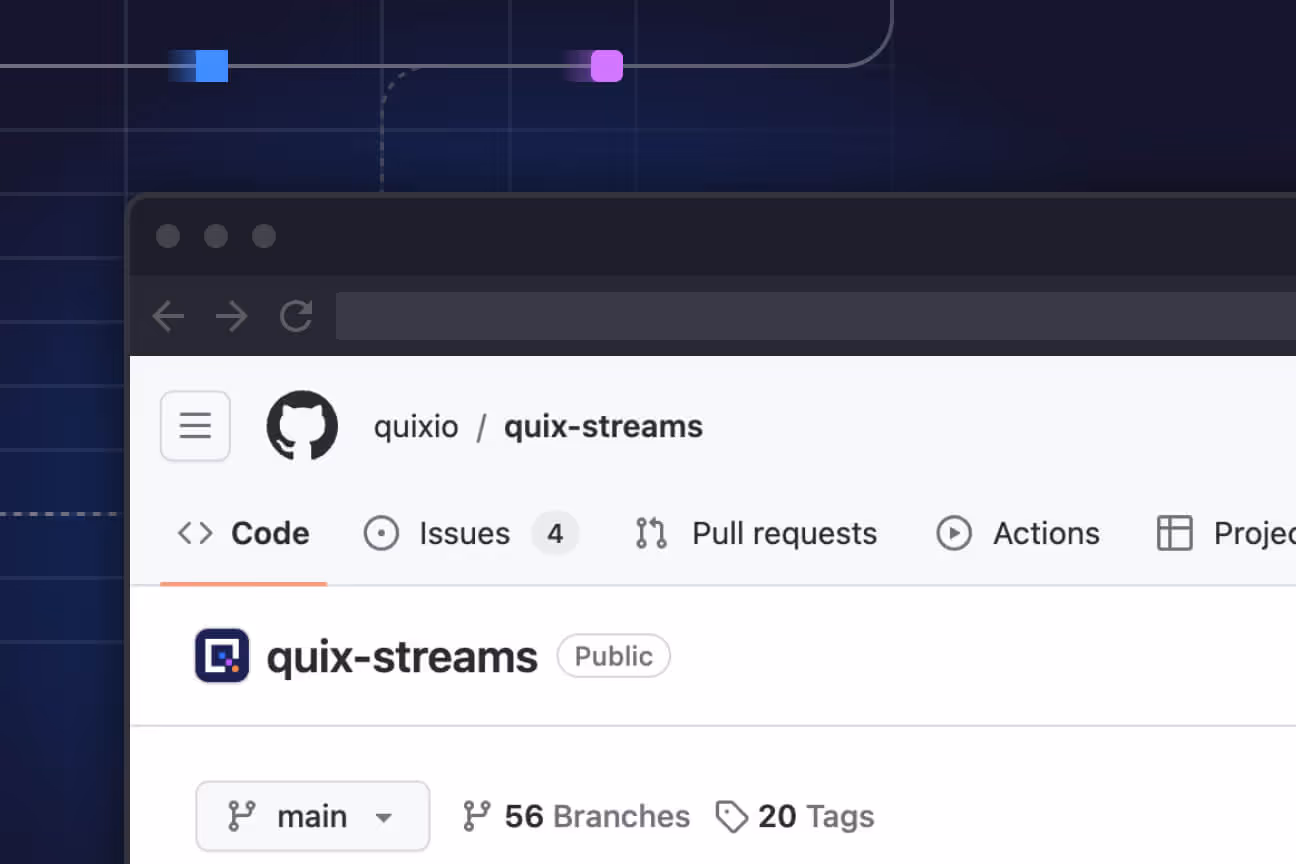
Check out the repo
Our Python client library is open source, and brings DataFrames and the Python ecosystem to stream processing.
Interested in Quix Cloud?
Take a look around and explore the features of our platform.
Interested in Quix Cloud?
Take a look around and explore the features of our platform.