Choose the deployment option that fits your business

Multi-tenant cloud

Single tenant cloud

A Python-native platform for streaming, storing, and processing engineering test data across your entire development lifecycle—from MIL simulation through vehicle testing. Engineers build data workflows in Python while Quix handles the infrastructure, deployment, and observability.
The Control Plane gives you a single interface to manage all your data projects, teams, and infrastructure—even when they're running on completely separate networks or cloud accounts. Your teams work independently in their own environments, but you maintain oversight of who has access to what, how resources are being used, and which applications are running in production. It's built for engineering organizations where different teams need autonomy to move fast, but leadership needs confidence that critical systems are properly governed and production environments are protected.
Key benefits:
Fully managed Kubernetes infrastructure where your applications actually run—in the cloud, on-premise, or hybrid. Deploy to shared serverless infrastructure for development, dedicated isolated clusters for production workloads, or your own cloud account (BYOC) for compliance requirements. Completely managed infrastructure, so your team focuses on building applications instead of managing Kubernetes clusters.
Key benefits:
Serverless Private Compute lets you deploy Docker containers into dedicated Kubernetes node pools without touching Kubernetes configuration. Your team gets ephemeral, on-demand compute environments for development and production workloads—spin them up when needed, tear them down when done. The infrastructure runs in isolated private node pools, giving you the security and performance of dedicated resources with the convenience of serverless deployment. Engineers deploy containers directly from their projects without waiting for IT to provision infrastructure or learning Kubernetes operations.
Key benefits:
Fully Managed Kafka provides multi-tenant Kafka clusters that are ready to use immediately, with optional public internet exposure secured by token-based authentication. Engineers self-serve access to Kafka without waiting for infrastructure teams—Quix provisions clusters, manages broker configuration, handles scaling, and maintains uptime. Multiple teams can share a single cluster safely, or Quix can provision dedicated clusters for specific needs. The infrastructure is managed end-to-end, so teams focus on building data pipelines instead of operating message brokers.
Key benefits:
Bring Your Own Broker lets you connect Quix to your organization's existing Kafka setup instead of using managed clusters. If you've already invested in Confluent Cloud, self-hosted Kafka, or internal message broker infrastructure, Quix integrates with it directly. You maintain full control over your Kafka environment—configuration, access policies, network isolation—while getting Quix's pipeline development tools, monitoring, and deployment capabilities on top. Engineers build pipelines in Quix that read and write to your existing topics without vendor lock-in or forced migration.
Key benefits:
Service Level Agreements provide performance guarantees for Quix infrastructure and support response times. Business tier gets 99.9% uptime with 9/5 support response, while Enterprise tier provides 99.99% uptime with 24/7 support coverage. These SLAs ensure your production data pipelines run reliably with defined support commitments when issues arise. Quix monitors infrastructure health, responds to incidents within agreed timeframes, and maintains the reliability your organization needs for mission-critical test data systems.
Key benefits:
Bring Your Own Cloud deploys Quix's data plane infrastructure directly into your AWS, Azure, or GCP account. You get dedicated, private infrastructure that never touches shared environments—complete isolation for security, compliance, or performance requirements. Quix manages the software layer while the infrastructure runs in your VPC on your subscription. This gives you full visibility into costs, network traffic, and resource usage while maintaining the simplicity of managed services. Perfect for organizations with strict data sovereignty, security policies, or need infrastructure-level control.
Key benefits:
Grafana Dashboards provide ready-made visualizations for monitoring your Quix infrastructure and data pipelines. These dashboards connect to your cluster's metrics automatically, showing CPU usage, memory consumption, Kafka throughput, consumer lag, and deployment health in real-time. Instead of building monitoring from scratch, you get production-ready dashboards that surface the metrics that matter. Customize them to add your own panels or use them as-is to track system performance, troubleshoot issues, and ensure your data platform is running optimally.
Key benefits:
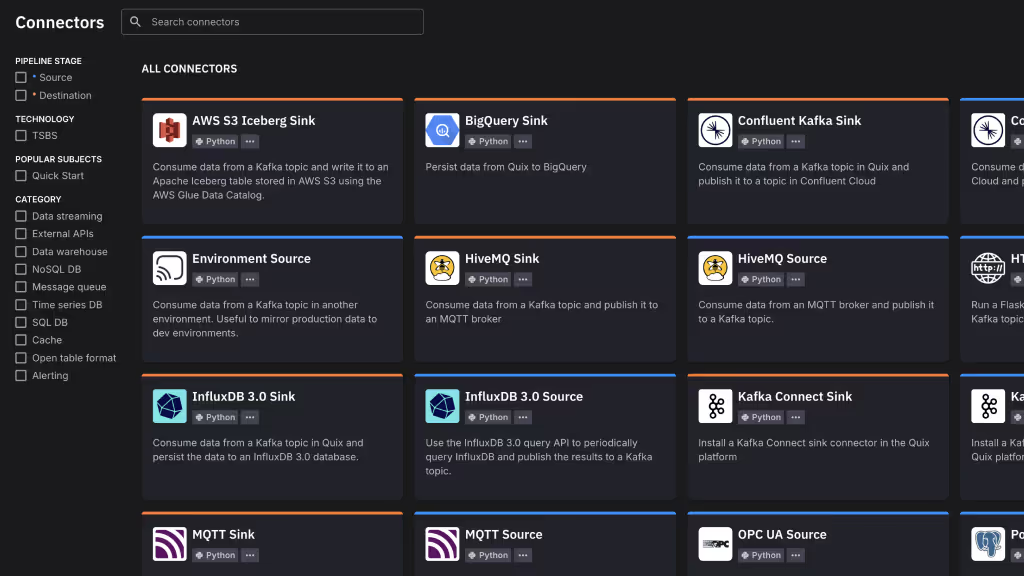
Connectors are composable source and sink templates that let you stream live test data from rigs, fleets, and databases directly into Quix — or pipe processed results back out. They handle the heavy lifting: buffering, retries, threading, and lifecycle control. You get reliable, extensible interfaces designed for real-time industrial and R&D environments.
Key benefits:
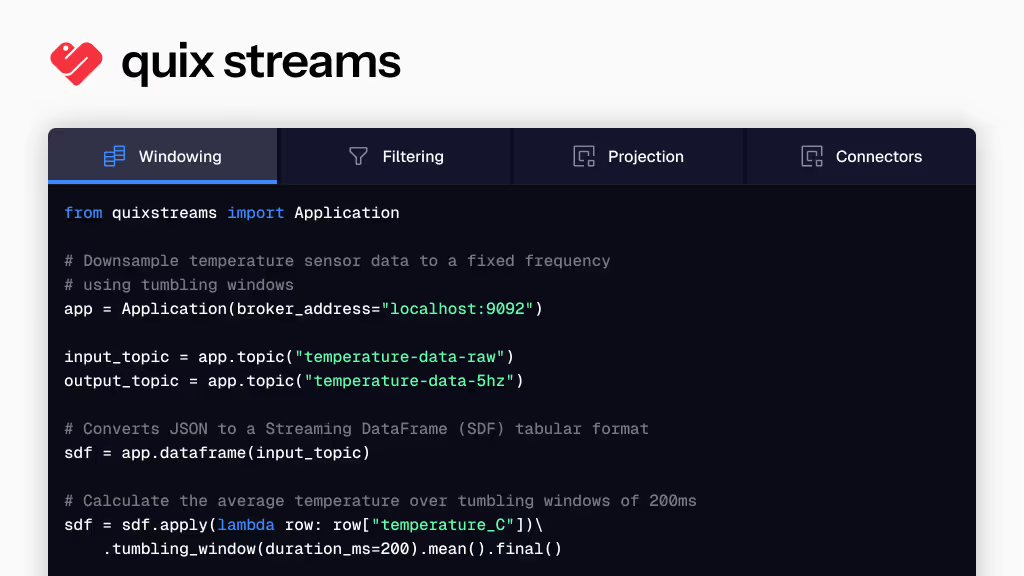
An open-source Python library for building real-time data pipelines on Kafka using a Pandas-like DataFrame API. Provides built-in operators for industrial data challenges: tumbling windows for time-aligning heterogeneous streams, graceful periods for late-arriving configuration data, stateful aggregations with automatic checkpointing, and backpressure-aware sinks that batch database writes to prevent overload.
Key benefits:
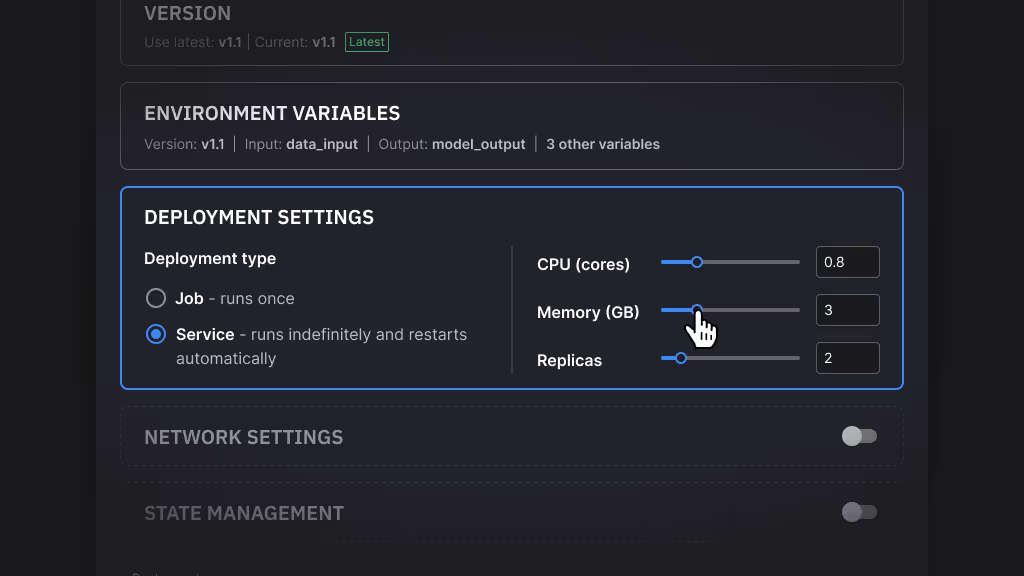
Auto Scaling elastically adjusts compute resources for your data pipelines based on actual load. Set maximum limits for replicas, CPU, and memory, and Quix scales deployments up during high-volume periods and down when load decreases. This handles bursty workloads automatically—like when aircraft land or test rigs start generating data—without over-provisioning resources that sit idle. Your pipelines get the compute they need when they need it, while you only pay for resources actually used.
Key benefits:
Real-Time Data Metrics give you centralized visibility into data flowing through your pipelines. Track message throughput, processing rates, and data volume across all deployments and topics from a single view. See which pipelines are active, identify bottlenecks, and spot issues before they impact downstream systems. Metrics update in real-time as data moves through your platform, so you can verify pipelines are processing correctly and troubleshoot problems quickly when metrics deviate from expected patterns.
Key benefits:

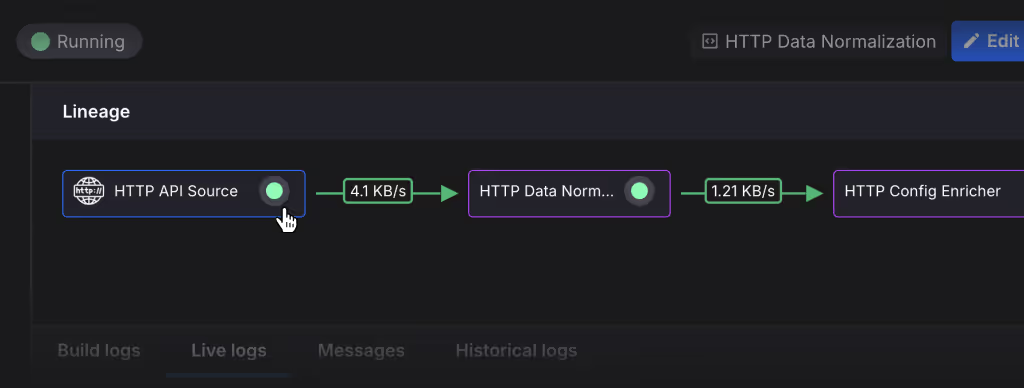
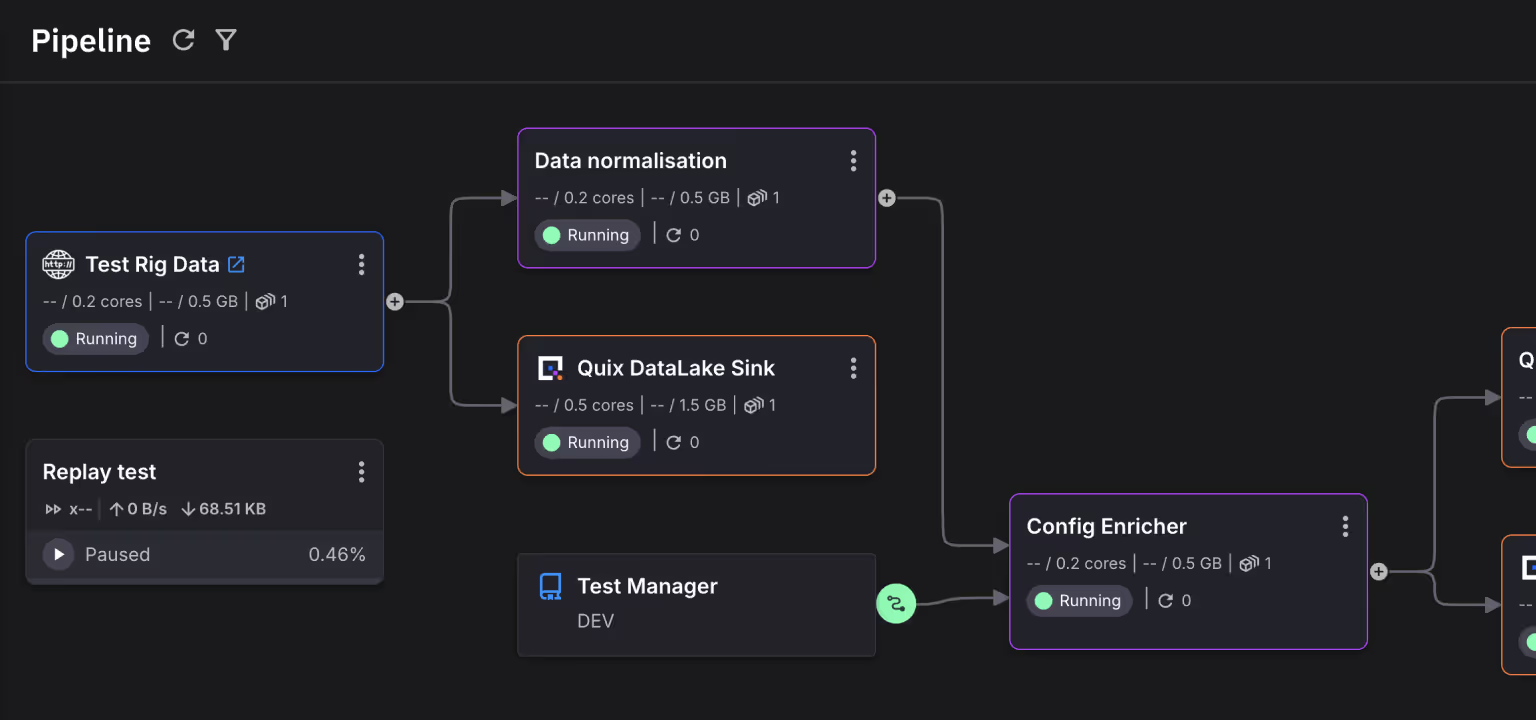
Lineage tracks how data moves through your pipelines, showing which applications consume from which topics, what transformations happen at each step, and where data ultimately ends up. This visibility helps you understand dependencies between applications, debug data quality issues by tracing problems back to their source, and document data flow for compliance requirements. When something breaks, lineage shows exactly what's upstream and downstream, so you can assess impact and fix the right component.
Key benefits:
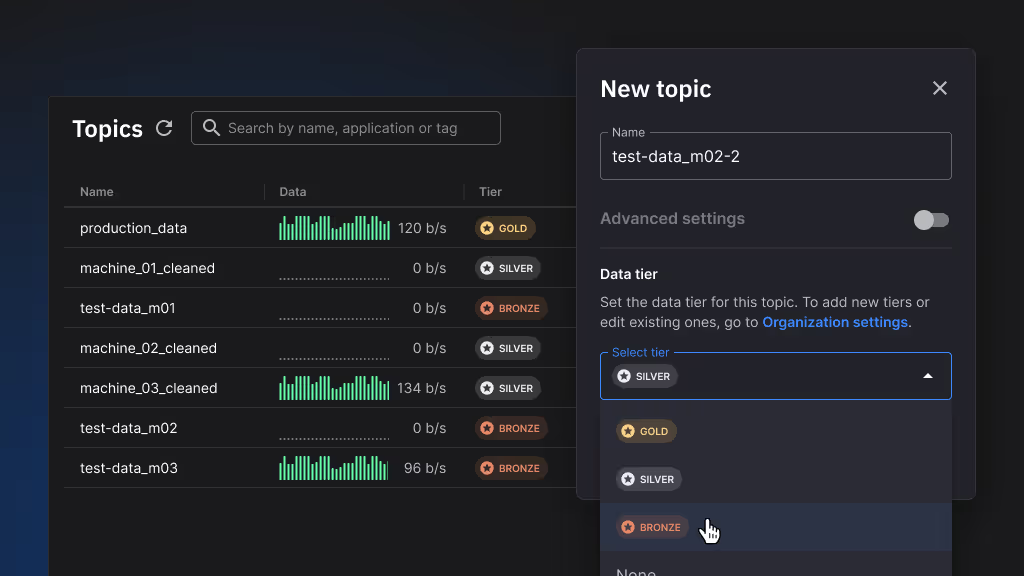
Medallion Data Tiers apply the medallion architecture pattern to test data, categorizing data by readiness and quality. Bronze holds raw, unprocessed data exactly as collected from sensors and test rigs. Silver contains cleaned, validated data with transformations applied. Gold represents analytics-ready data—enriched with configurations, aggregated, and prepared for analysis. This organization makes data quality explicit, improves communication between teams about what data is ready for which purposes, and provides clear boundaries for where different types of processing happen.
Key benefits:
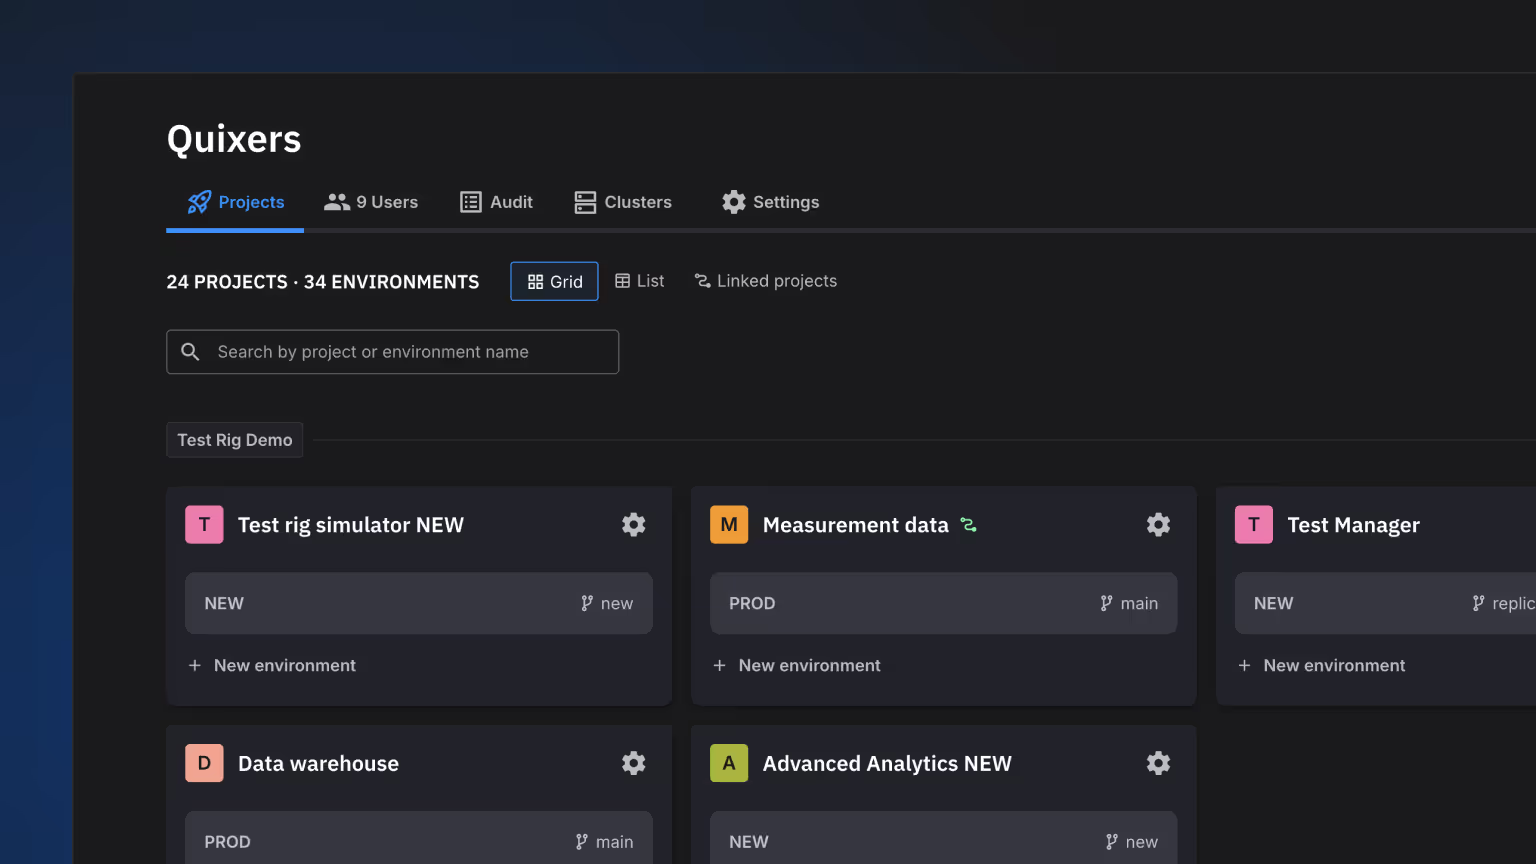
Projects organize your data platform work into self-contained units, each backed by a single Git repository. A project contains all applications, topic definitions, and configuration for a logical grouping of work. Each project can have multiple environments (dev, staging, production) mapped to Git branches, giving you standard software development workflows for data pipelines. IT teams provision resources at the project level, engineers develop features in branches before merging, and Git provides complete revision history for all changes.
Key benefits:
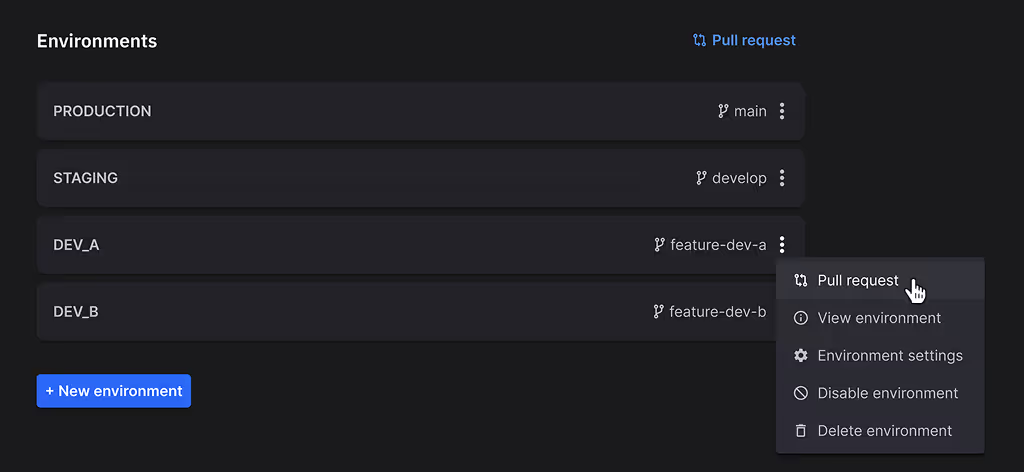
Environments let you manage different deployment stages within a project. Create separate development, staging, and production environments, each with its own infrastructure, topics, and deployed applications. Environments map to Git branches, so your dev environment tracks your development branch while production tracks main. This isolation lets engineers experiment safely in development, validate changes in staging, and deploy confidently to production—all within the same project structure. Changes flow through environments via Git merges and synchronization.
Key benefits:
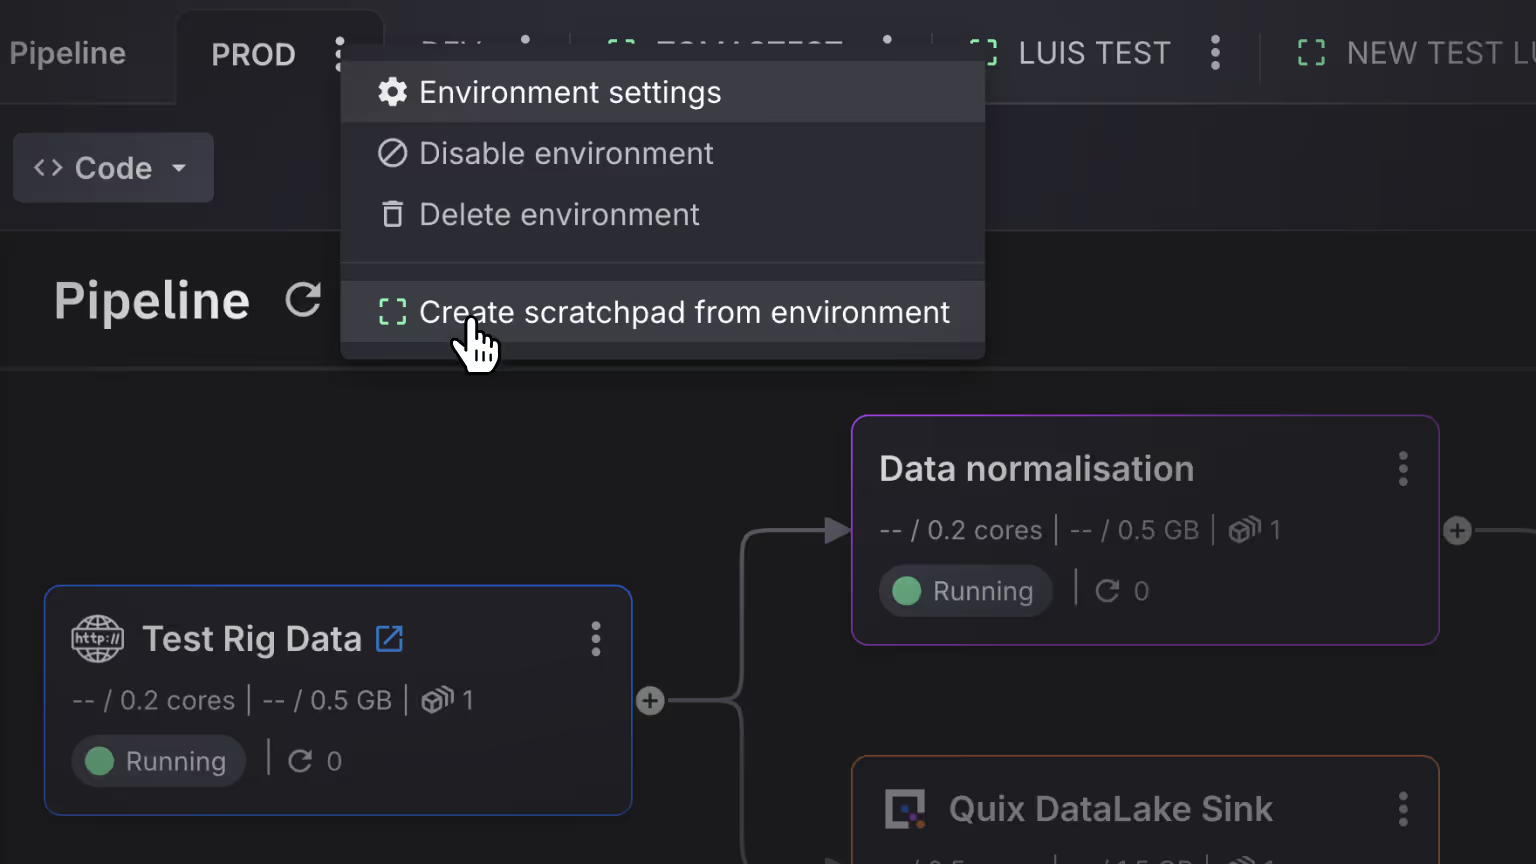
Scratchpads are ephemeral environments for rapid iteration and testing. Spin up a temporary environment, experiment with real production data, try out new approaches, and delete it when done—without creating branches, affecting other environments, or cluttering your project. Scratchpads run completely isolated from development, staging, and production, giving you a safe sandbox for prototyping transformations, testing connectors, or debugging issues with live data. They're perfect for those 'let me try something' moments that don't need formal version control.
Key benefits:
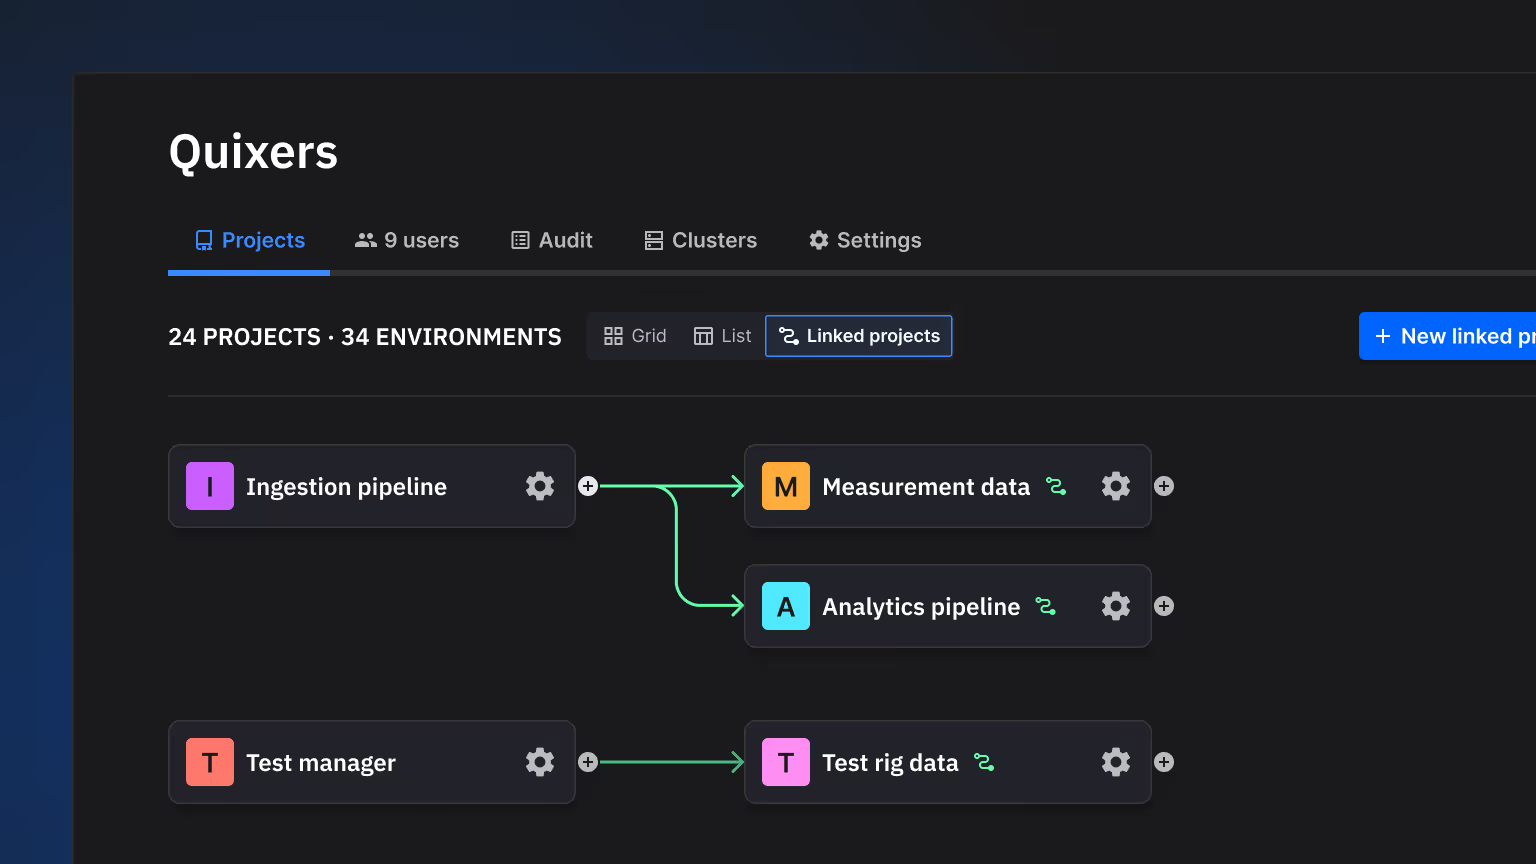
Project Links enable data sharing across project boundaries. Connect topics from one project as inputs to another, creating cross-project data flows while maintaining project isolation. A graphical view shows these connections, making it easy to see which teams consume your data and what upstream sources you depend on. This enables collaboration between teams working in separate projects while keeping project boundaries clear. Teams maintain autonomy over their own projects while safely consuming data produced by other teams.
Key benefits:
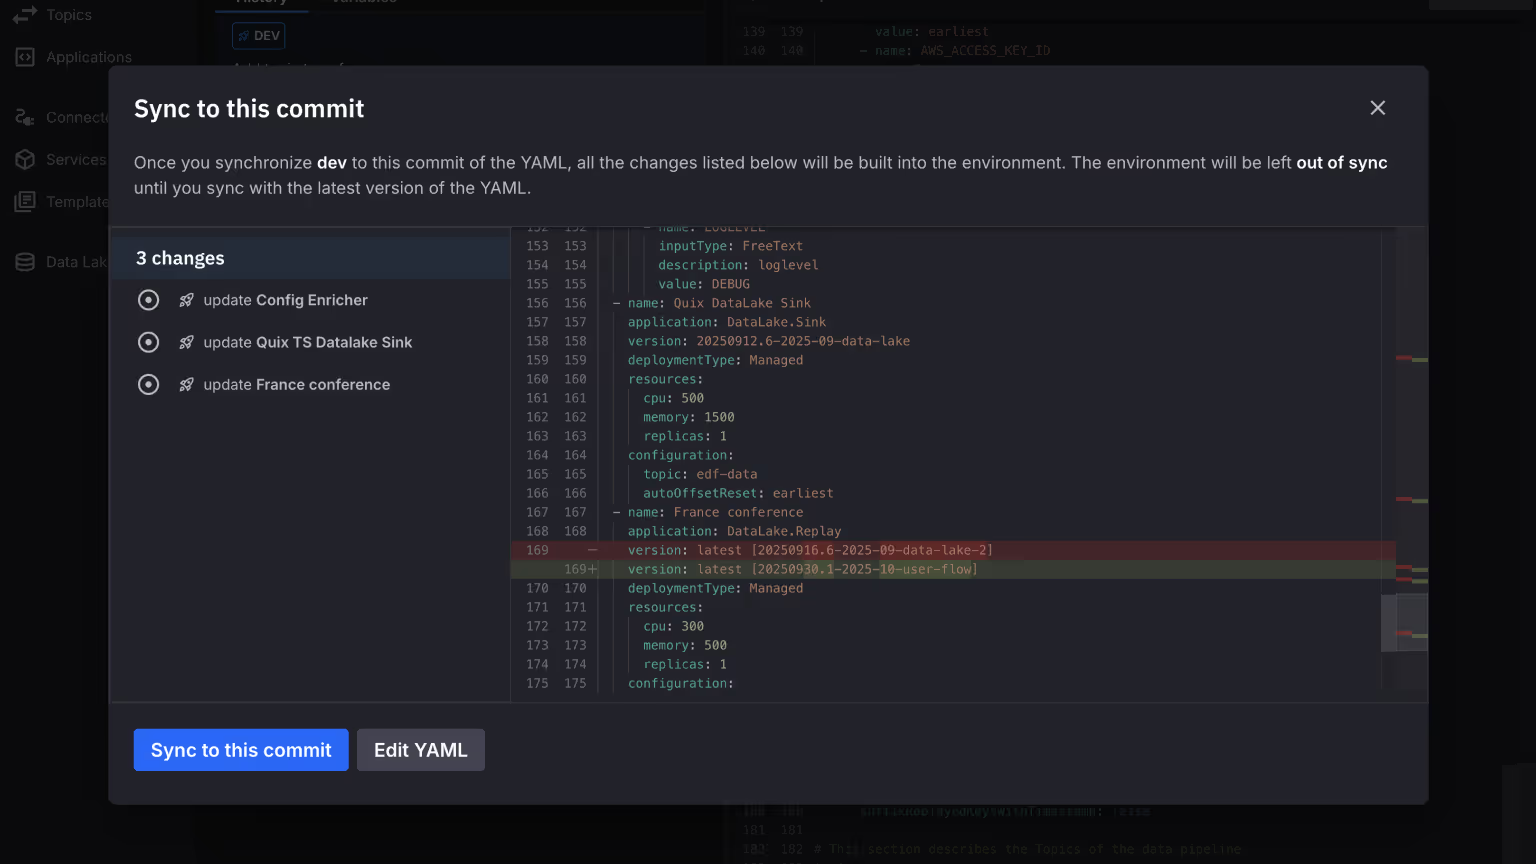
Synchronization keeps your Quix environments aligned with your Git repository in one operation. Changes to YAML files, deployment configurations, or topic definitions in Git get applied to the corresponding environment with a single sync command. Your Git repo becomes the source of truth—what's in the main branch is what runs in production. This eliminates configuration drift between environments, ensures consistent deployments across staging and production, and makes rollbacks as simple as reverting a Git commit and re-syncing.
Key benefits:
Pipeline View provides a visual representation of your data integration architecture. See how applications connect through topics, which pipelines are actively processing data, and what the topology of your data flows looks like. Applications appear as tiles, topics as connecting lines, with color coding showing active vs. inactive streams. This graphical view makes it easy to understand pipeline structure at a glance, spot which applications consume or produce specific data, and share pipeline architecture with stakeholders who need visibility into how data moves through your system.
Key benefits:
Containerised Apps let you deploy any application that runs in Docker. Write your Dockerfile, define dependencies, and deploy to Quix infrastructure at whatever horizontal and vertical scale you need. You have full control over the container image—edit the Dockerfile to install system packages, modify the base image, or configure runtime settings. Any Docker-compatible application works, whether it's Python, Java, Go, or custom binaries. Applications scale independently with their own resource allocations and replica counts.
Key benefits:
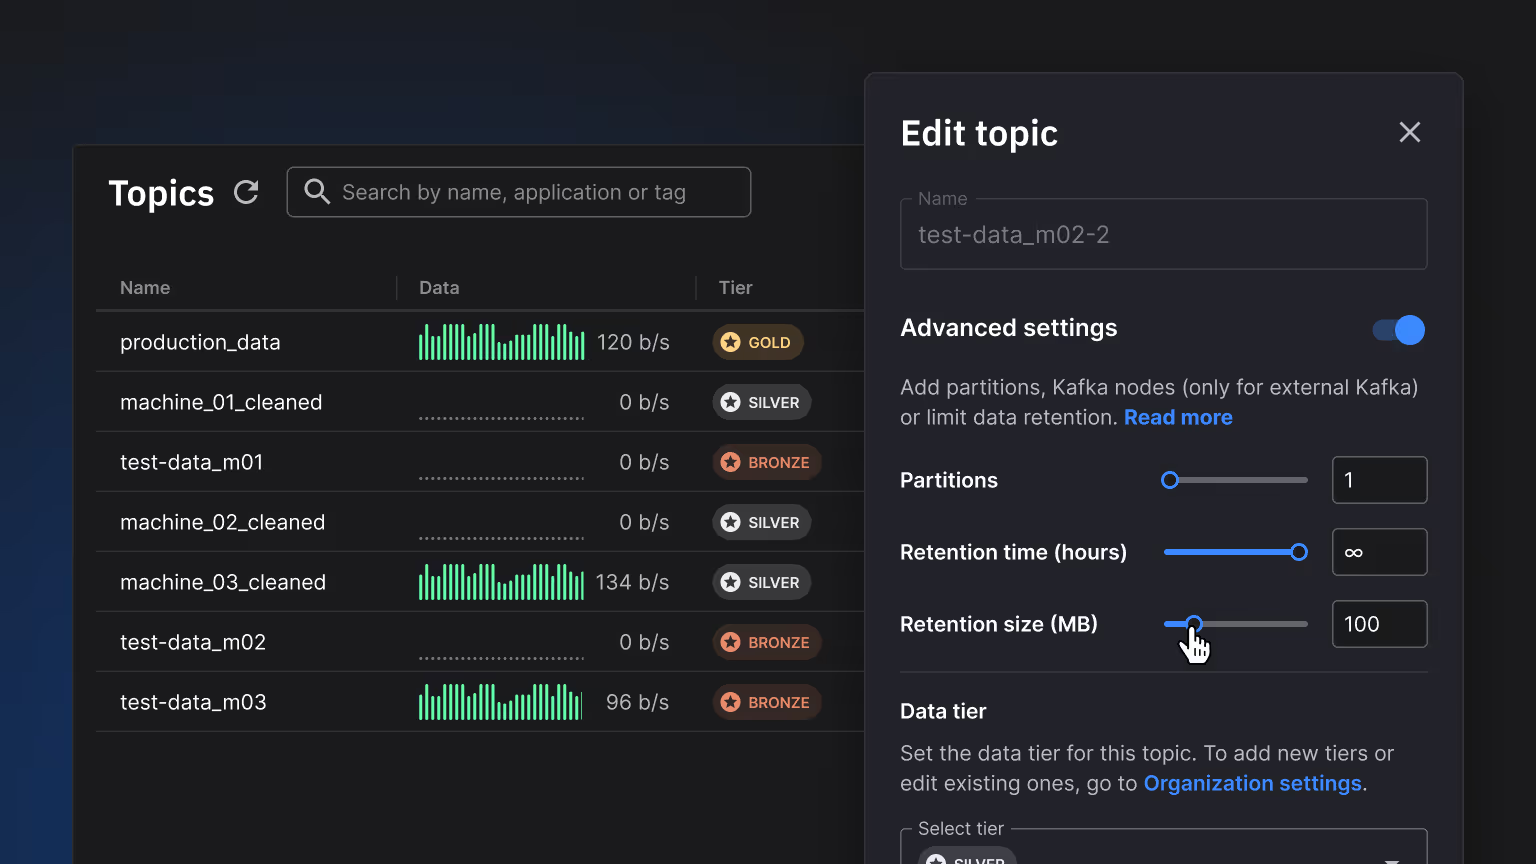
Topics Management provides a self-service interface for Kafka topic configuration. Engineers create topics, adjust partition counts, set retention policies, and modify replication factors without submitting IT tickets or touching broker configuration directly. This puts topic management in the hands of teams building pipelines, while maintaining proper defaults and guardrails. Teams iterate quickly on topic configuration as their pipelines evolve, enabling a self-serve Kafka platform where data engineers control their own infrastructure.
Key benefits:
Deployment Management provides straightforward controls for managing application deployments. Start, stop, restart, or delete deployments as needed for development, troubleshooting, or operational tasks. Edit deployment settings like resource allocation, environment variables, or scaling parameters without redeploying from scratch. These controls eliminate the complexity and error-prone nature of manual deployment operations—you manage applications through a clear interface rather than kubectl commands or configuration files. Operations that would be risky or complex become simple, repeatable actions.
Key benefits:

Network Configuration lets you control how deployments connect to each other and expose services externally. Define internal ports for service-to-service communication within your infrastructure, configure public URLs when applications need external access, and set up target ports for container networking. This simplifies what would otherwise require Kubernetes networking knowledge—you specify how applications should be reachable, and Quix handles the underlying ingress, service meshes, and routing. Engineers configure network connectivity through straightforward settings rather than YAML manifests or networking primitives.
Key benefits:
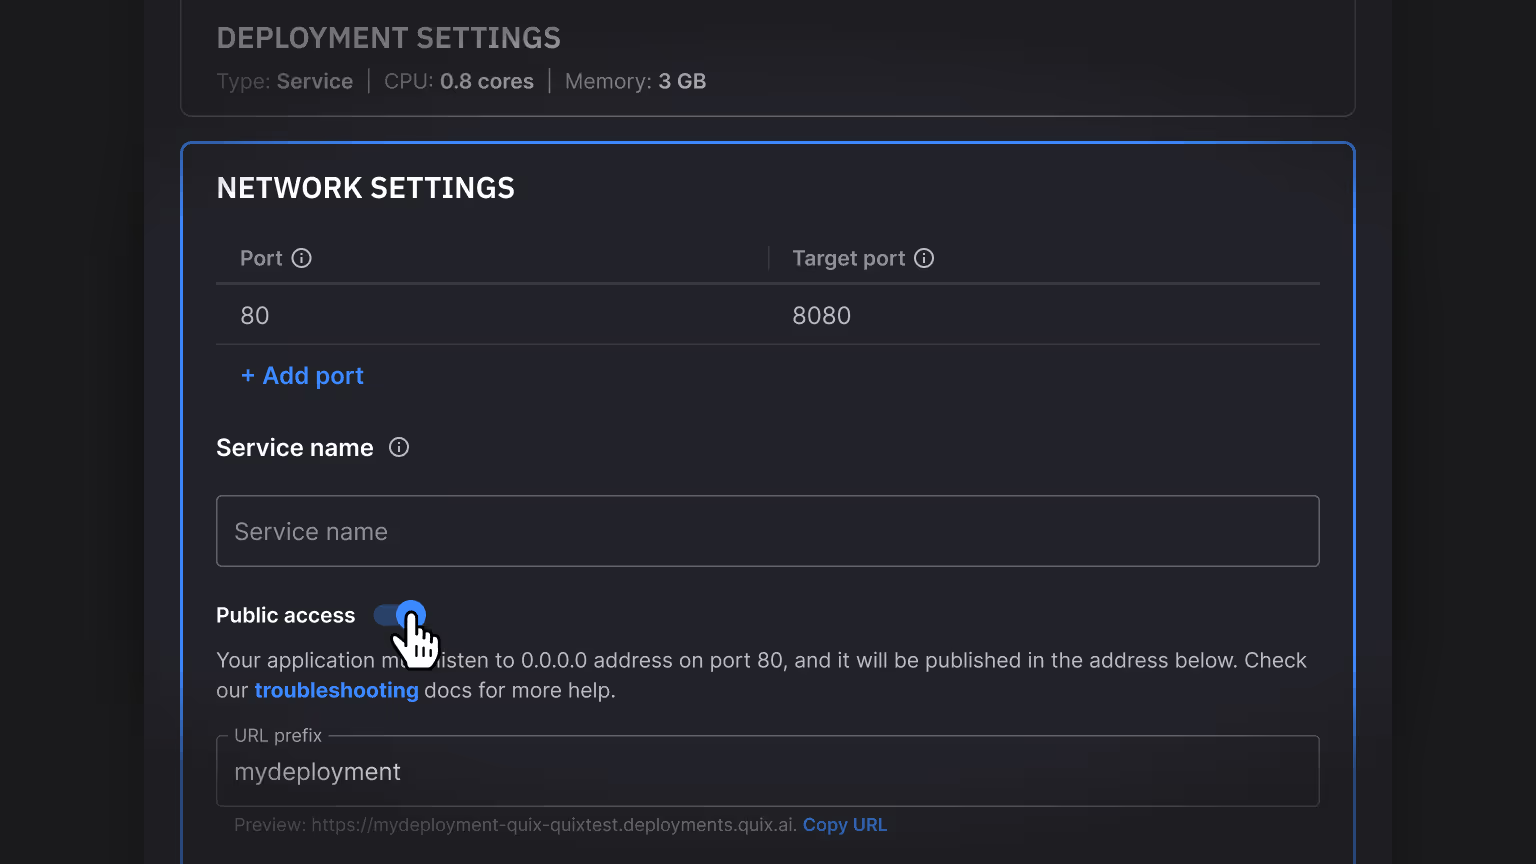
State Management enables stateful deployments backed by persistent volumes. Applications that need to maintain state—like databases, caches, or applications with local checkpoints—get Kubernetes PersistentVolumeClaims automatically configured and attached. When containers restart, state persists. This eliminates a major pain point in running stateful workloads on streaming infrastructure—you can deploy applications that require persistence without becoming a Kubernetes storage expert. Configure volume size and mount paths, and Quix handles provisioning, attachment, and lifecycle management.
Key benefits:

Environment Variables provide flexible application configuration without code changes. Inject input/output topic names, reference secrets securely, and define custom variables that containers read at runtime. Variables can differ between environments—use test topics in development and production topics in production, all from the same application code. This separates configuration from code, enables reusable application templates across teams, and makes it easy to adapt applications to different contexts by changing variables instead of modifying source code.
Key benefits:

App Templates provide pre-built, working applications for common use cases. Start with templates for REST APIs, machine learning models, simulation runners, data visualization dashboards, or ETL patterns instead of building from scratch. Each template includes working code, proper error handling, configuration examples, and documentation. You can deploy templates as-is for standard use cases or customize them for specific requirements—they serve as both starting points for new work and reference implementations showing best practices.
Key benefits:

Private App Templates let enterprises create internal template libraries with organization-specific applications, connectors, and patterns. Codify your team's best practices, compliance requirements, and standard architectures into templates that engineers can deploy and customize. Unlike public templates, private templates contain your proprietary logic, approved integrations, and organizational conventions. This enables self-service while ensuring consistency—engineers move fast using approved patterns rather than reinventing or making architecture decisions from scratch each time.
Key benefits:
Services provide instant access to common technology infrastructure for development. Spin up databases, Redis caches, message gateways, API routers, or monitoring tools as containerized services without asking IT to provision production infrastructure. These services are meant for development and prototyping—quick access to the technologies you need to build and test pipelines locally before moving to production-grade infrastructure. Engineers prototype solutions with real technology stacks instead of mocking dependencies or waiting for infrastructure provisioning.
Key benefits:

Multi Language Support enables development in the language your team prefers. Use Python or C# SDKs with Quix-specific features like StreamingDataFrame, or use any programming language via standard Kafka clients. This flexibility means engineers work in languages they know—data scientists use Python, .NET teams use C#, and Java developers can use Kafka clients directly. No forced language adoption or team-wide retraining. Applications in different languages work together seamlessly through Kafka topics, so each team uses the right tool for their work.
Key benefits:

The Build and Deploy Service automates the path from code to running applications. Push code to Git, and the service automatically builds Docker containers, runs tests, and deploys to your environment. No manual docker build commands, no kubectl apply steps, no CI/CD configuration to write. The service handles building containers with proper caching, pushing images to registries, and rolling out deployments with zero-downtime strategies. Engineers focus on code while the infrastructure handles builds, tests, and deployment orchestration.
Key benefits:
Bring Your Own Container lets you deploy existing Docker images directly to Quix infrastructure. If you have pre-built images in DockerHub, private registries, or artifact repositories, reference them directly without rebuilding from source. This works for third-party containers, legacy applications, or images built by external CI/CD systems. You maintain your existing build processes and image management while running containers on Quix infrastructure. Perfect for deploying vendor applications, integrating with existing DevOps workflows, or using containers built outside Quix.
Key benefits:
The Quix CLI brings Quix development to your local machine. Develop applications locally, test pipelines using Docker Desktop, and deploy to Quix Cloud from your terminal. The CLI replicates the cloud environment locally—run multiple applications, connect them through topics, and verify behavior before deploying. This enables familiar development workflows: edit code in your IDE, test locally, commit to Git, and deploy via CLI or CI/CD. No switching between local development and cloud interfaces—code, test, and deploy from your command line.
Key benefits:

Online Code Editors provide a full Python development environment in your browser. Edit application code, get IntelliSense code completion, access Quix library documentation, and test changes without installing anything locally. The editor connects directly to your projects—modify deployed applications, create new ones, or experiment with examples all from the browser. This enables quick iterations and makes it easy for team members to review code, make small fixes, or prototype ideas without cloning repositories or setting up development environments.
Key benefits:

Dev Containers provide reproducible development environments that match your production configuration. Define your development container with all dependencies, tools, and settings needed for working on Quix projects. Other team members open the same dev container definition and get an identical environment—no 'works on my machine' problems. Dev Containers work with VS Code and other IDEs supporting the dev container standard, giving you consistent development environments locally while ensuring code runs the same way in production.
Key benefits:
Real-time Data Explorer lets you inspect data flowing through your pipelines as it happens. Open any topic and see messages streaming in with full contents visible—JSON payloads, timestamps, keys, and metadata. This makes debugging interactive: watch data transform as it moves through pipeline stages, verify that sensors are producing expected values, or check that enrichment is working correctly. The explorer helps you understand data structure, validate transformations, and troubleshoot issues by seeing actual messages rather than inferring from logs.
Key benefits:

Message Visualizer provides instant visualization of time-series data flowing through topics. Select parameters from your data streams and see them plotted in real-time charts. This helps engineers understand data behavior visually—spot patterns, identify anomalies, or compare multiple signals without writing visualization code. The visualizer works directly on raw topic data, so you can quickly check if sensor data looks reasonable, verify that transformations produce expected patterns, or share live visualizations with team members during debugging sessions.
Key benefits:
Topic Metrics expose key Kafka performance indicators for topics and consumers. Track message throughput, consumer lag (how far behind consumers are), and partition offsets in real-time. These metrics help you ensure consumers are keeping up with producers, identify slow consumers that might be falling behind, and spot throughput bottlenecks in your data flows. When consumers start lagging or throughput drops unexpectedly, Topic Metrics make the problem visible immediately so you can investigate and fix issues before they impact downstream systems.
Key benefits:

Git Integration makes every Quix project a Git repository with seamless integration to GitHub, GitLab, Bitbucket, or any Git provider. Projects track all changes—applications, topic definitions, environment variables—in version control. Use standard Git workflows: branch for new features, create pull requests for review, merge to deploy. This enables continuous integration and delivery with your existing CI/CD tools and processes. Your data platform infrastructure becomes code, with all the benefits of version control, collaboration, and automation that come with Git-based development.
Key benefits:
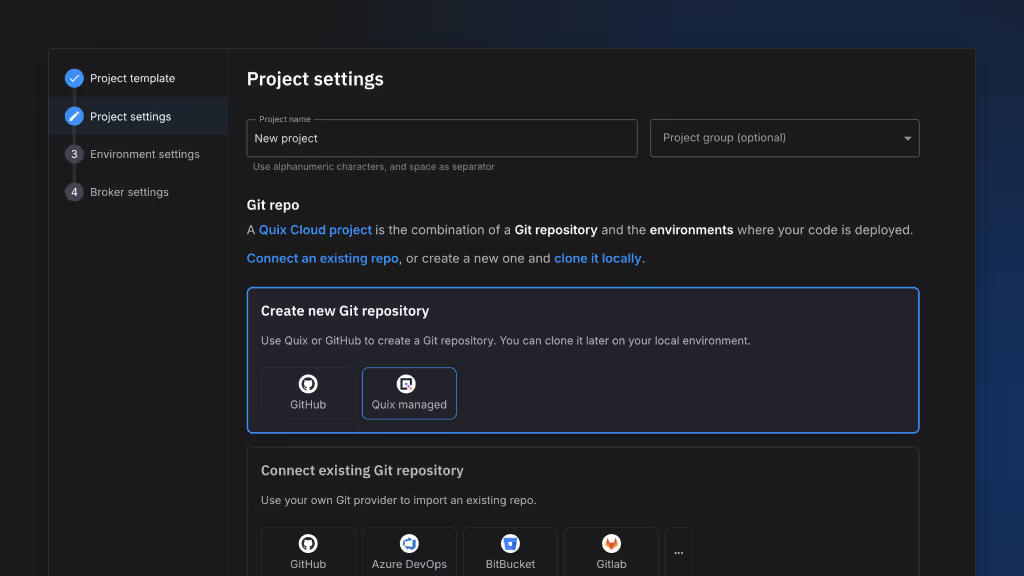
Environment Management coordinates multiple environments within a project, each tied to a specific Git branch. Development environments track feature branches, staging tracks the develop branch, and production tracks main. This creates automatic alignment between Git workflow and infrastructure—merge a pull request and sync to deploy changes through environments. Each environment maintains its own deployed applications, topics, and configuration, while sharing the same underlying project structure and Git history.
Key benefits:

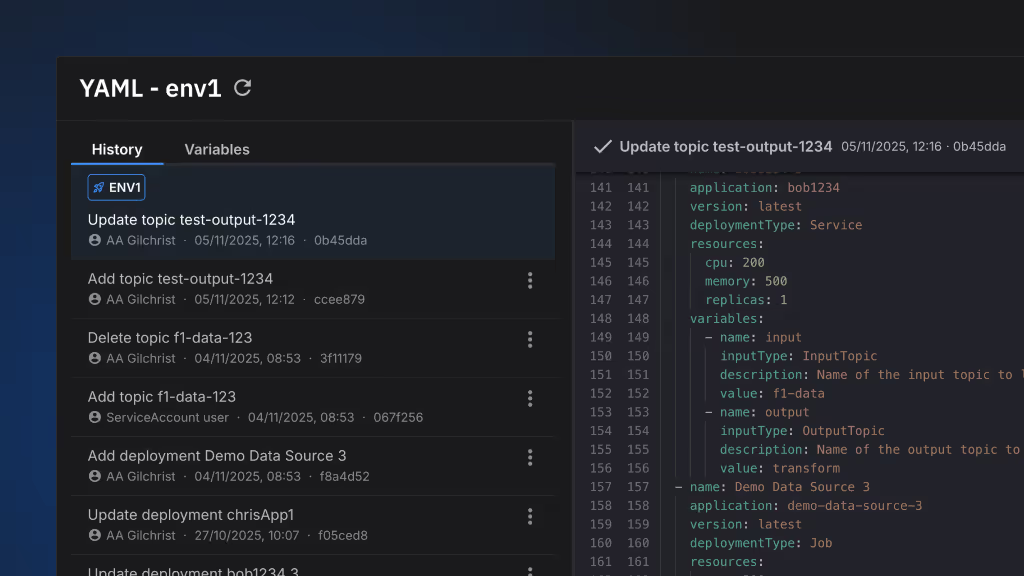
Infrastructure as Code lets you define your entire pipeline infrastructure in YAML files stored in Git. Deployments, topics, environment variables, and configuration live in quix.yaml and app.yaml files alongside your application code. This makes infrastructure changes visible in Git diffs, reviewable in pull requests, and automatically applied through synchronization. No more clicking through interfaces to configure resources—infrastructure definitions are code that you edit, version, and deploy like any other file in your repository.
Key benefits:
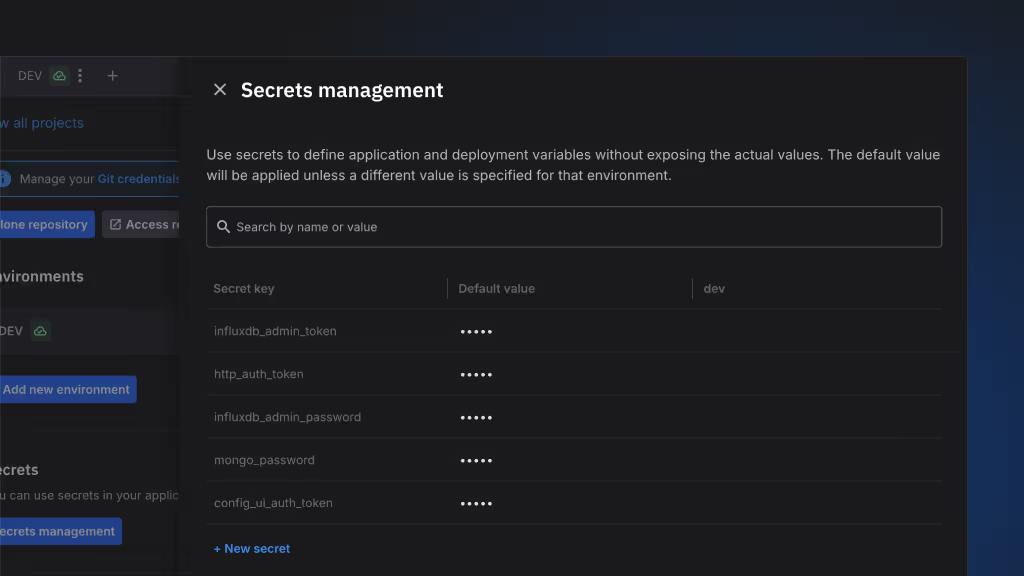
Secrets Management provides secure storage for sensitive information like API keys, database credentials, and authentication tokens. Secrets are encrypted at rest and accessed through environment variables at runtime, never hardcoded in application code or configuration files. Different secrets can be defined per environment—development uses test credentials while production uses prod credentials, both referencing the same variable names in code. This separation enhances security, simplifies credential rotation, and ensures applications work consistently across environments without exposing sensitive data.
Key benefits:
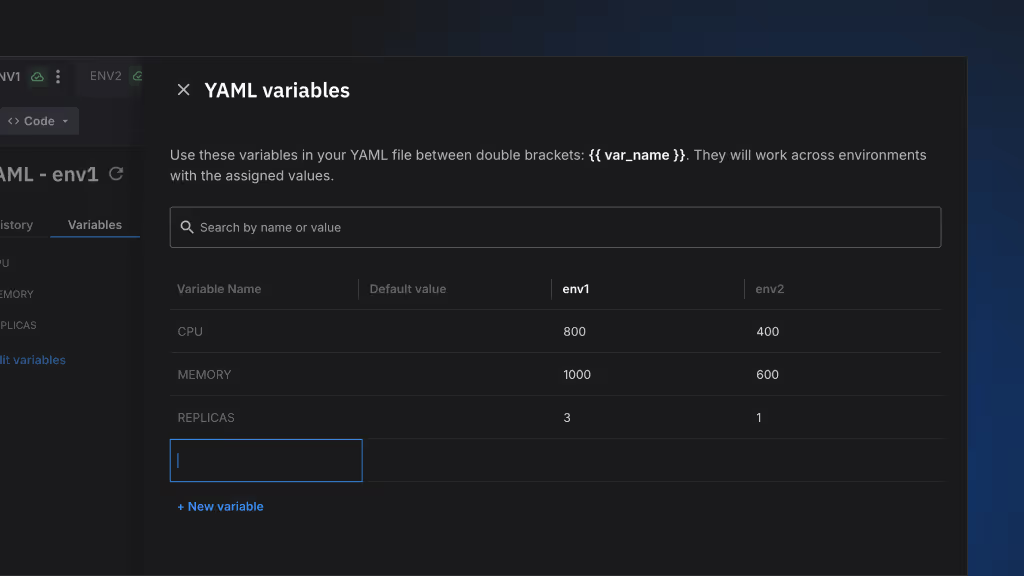
YAML Variables let you define values once in quix.yaml and reference them throughout your project configuration. Instead of repeating the same database connection string across multiple deployments, define it as a variable and reference it wherever needed. Variables can differ by environment—set one value for development and another for production, while the application YAML files remain identical. This reduces duplication, prevents configuration errors from inconsistent values, and makes environment-specific settings explicit and manageable.
Key benefits:
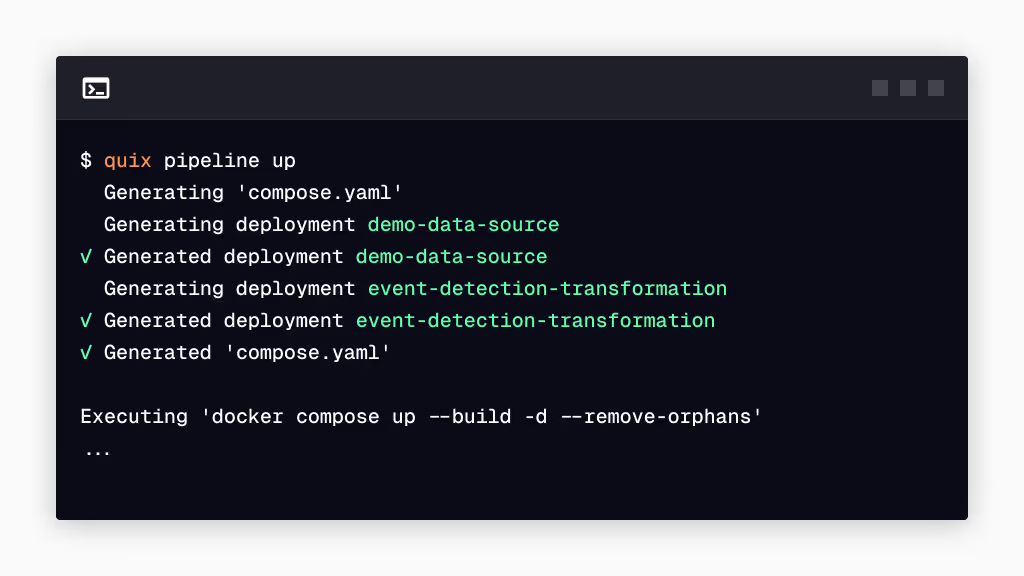
CLI Commands provide command-line access to Quix Cloud operations, enabling integration with any CI/CD system. Deploy applications, synchronize environments, manage topics, or query status through shell commands in your GitHub Actions, GitLab CI, Jenkins, or custom automation scripts. This unlocks workflow automation beyond the web interface—trigger deployments on Git pushes, run tests against Quix environments, or orchestrate complex multi-step operations. The CLI brings Quix into your existing automation toolchain rather than forcing you to adapt to Quix-specific workflows.
Key benefits:
User Management lets you invite team members to your organization and control what they can access and modify. Assign users to specific projects, grant read-only or full access, and manage permissions at the organization and project level. This enables secure collaboration—engineers work on their assigned projects without accessing sensitive production systems, managers maintain visibility across all projects, and administrators control organization-wide settings. User permissions integrate with your organizational structure rather than forcing everyone into a single access level.
Key benefits:
Enterprise-grade authentication through integration with your existing identity providers like Active Directory or Google Workspace. Users access Quix with their corporate credentials while administrators manage permissions centrally. Available exclusively on Enterprise plans, SSO provides audit logging, role-based access control, and rapid provisioning to meet security, compliance, and governance requirements.
Key benefits:
Personal Access Tokens (PAT) enable secure API authentication for scripts, applications, and CI/CD tools accessing Quix. Generate tokens with specific scopes and expiration dates, use them in automation workflows, and revoke them when no longer needed. Unlike password-based authentication, tokens can be created for specific purposes—one token for CI/CD deployments, another for monitoring scripts—and revoked individually without affecting other access. This provides secure API access with fine-grained control over what each token can do.
Key benefits:
Broker Configuration provides control over Kafka broker settings when defaults don't fit your requirements. Adjust retention policies, tune performance parameters, configure network access, or set resource limits to match your organization's needs. This flexibility matters for organizations with specific compliance requirements, performance characteristics, or operational constraints that need broker-level customization. While most users work with sensible defaults, Broker Configuration gives you access to underlying Kafka settings when you need them.
Key benefits:
The Permission System provides role-based access control with granular permissions for different actions and resources. Define who can view projects, edit pipelines, manage users, deploy to production, or access sensitive data. Permissions work at multiple levels—organization-wide roles for administrators, project-specific access for engineering teams, and read-only access for stakeholders. This ensures teams have the access they need while protecting critical resources from accidental changes or unauthorized access.
Key benefits:
The Auditing System captures detailed logs of all user actions, configuration changes, deployments, and system events. Track who deployed what application, when configuration changed, which user accessed which resources, and what the system was doing during an incident. These logs support both compliance requirements (proving who did what for regulatory audits) and operational troubleshooting (understanding what changed before a problem started). Audit logs are immutable and queryable, providing complete history for security reviews and incident investigation.
Key benefits:
Project Visibility lets you control who can see and access each project and its environments. Make projects visible to entire teams for collaboration, restrict sensitive production projects to specific users, or create private projects for early-stage development. This separation ensures engineers see the projects relevant to their work without cluttering their view with unrelated infrastructure. Visibility controls work alongside permissions—even if users can see a project, their permissions determine what they can actually do with it.
Key benefits:
Live Logs provide real-time streaming of application logs from all deployed services. As your applications write logs, they appear instantly in the Quix interface—no delay, no manual fetching. This makes troubleshooting immediate: deploy a change, watch the logs stream in, and see errors as they happen. You can filter logs by deployment, search for specific messages, or watch multiple applications simultaneously. Live Logs eliminate the cycle of deploy, wait, fetch logs, repeat—you see what's happening right now.
Key benefits:

Historical Logs store application logs from past deployments for retrospective analysis. When investigating an issue that happened yesterday, last week, or months ago, retrieve the relevant logs to understand what your applications were doing at that time. Download logs for offline analysis, search through historical events to find patterns, or compare current behavior with past deployments. This is essential for debugging issues that don't reproduce consistently and for understanding how systems behaved before configuration changes.
Key benefits:

Build Logs capture the complete output from Docker container builds. When builds fail, you get detailed logs showing exactly which step failed, what error occurred, and the full context needed to fix it. These logs are centralized and accessible from the Quix interface—no need to SSH into build servers or tail log files on remote machines. Build Logs make deployment problems transparent: see dependency installation, compilation output, and any warnings or errors that occurred during the build process.
Key benefits:

Deployment Metrics show resource consumption for every deployed application. Track CPU utilization, memory usage, and disk space over time to understand performance characteristics and identify resource constraints. These metrics help you right-size deployments—provision enough resources to handle load without over-allocating expensive compute. When applications slow down or fail, metrics show whether the cause is resource exhaustion. Monitoring is automatic for all deployments, giving you visibility into infrastructure utilization without additional configuration.
Key benefits:

Advanced Logs and Metrics provide long-term storage and querying of logs and performance data using Loki and Prometheus. Beyond the standard log retention, Enterprise accounts get extended history with powerful query capabilities. Use PromQL to analyze metric trends over time, create custom dashboards, set up alerts on complex conditions, or export data for correlation with external systems. This enables sophisticated performance analysis—identifying patterns that emerge over weeks or months, comparing resource usage across deployments, and building historical baselines for capacity planning.
Key benefits:
A managed service that consolidates configuration metadata from heterogeneous sources—test rigs, simulation models, device parameters—into versioned JSON records. The service provides an API, Kafka event streams, and datastore that automatically link configuration snapshots to test data, publish configuration change events, and enable real-time enrichment of telemetry with configuration context.
Key benefits:
A managed data lakehouse built on blob storage that unifies configuration metadata and measurement data in open formats. QuixLake provides a SQL query layer over Parquet and Avro files stored in your cloud account, enabling engineers to analyze test data across campaigns using APIs, Python SDKs, or SQL queries without managing Iceberg tables or Spark clusters.
Key benefits:
A managed connector that writes streaming data from Kafka topics to QuixLake. Automatically handles batching, Parquet serialization with compression, schema evolution, partition management, and commit conflict resolution. Engineers deploy with Python while the service manages Iceberg protocols, catalog integration, and storage optimization without requiring expertise in lakehouse implementation.
Key benefits:
A managed service that searches, filters, and replays historical test data from QuixLake through processing pipelines. Select specific test sessions by time range or metadata tags, then reprocess them with updated algorithms, corrected configurations, or new models into existing or new projects without re-running physical tests or simulations.
Key benefits:
Data Query Engine provides a unified API for accessing all test and R&D data in your organization. Instead of engineers hunting for files in folder structures on desktops or building custom data access code, they query through a standard interface with consistent methods for filtering, sorting, and retrieving data. This moves organizations from distributed file-based storage to centralized cloud data management with programmatic access. Engineers write code against a stable API regardless of how data is stored underneath, enabling self-service access without IT intervention.
Key benefits: