.svg)
What can you build with Quix?
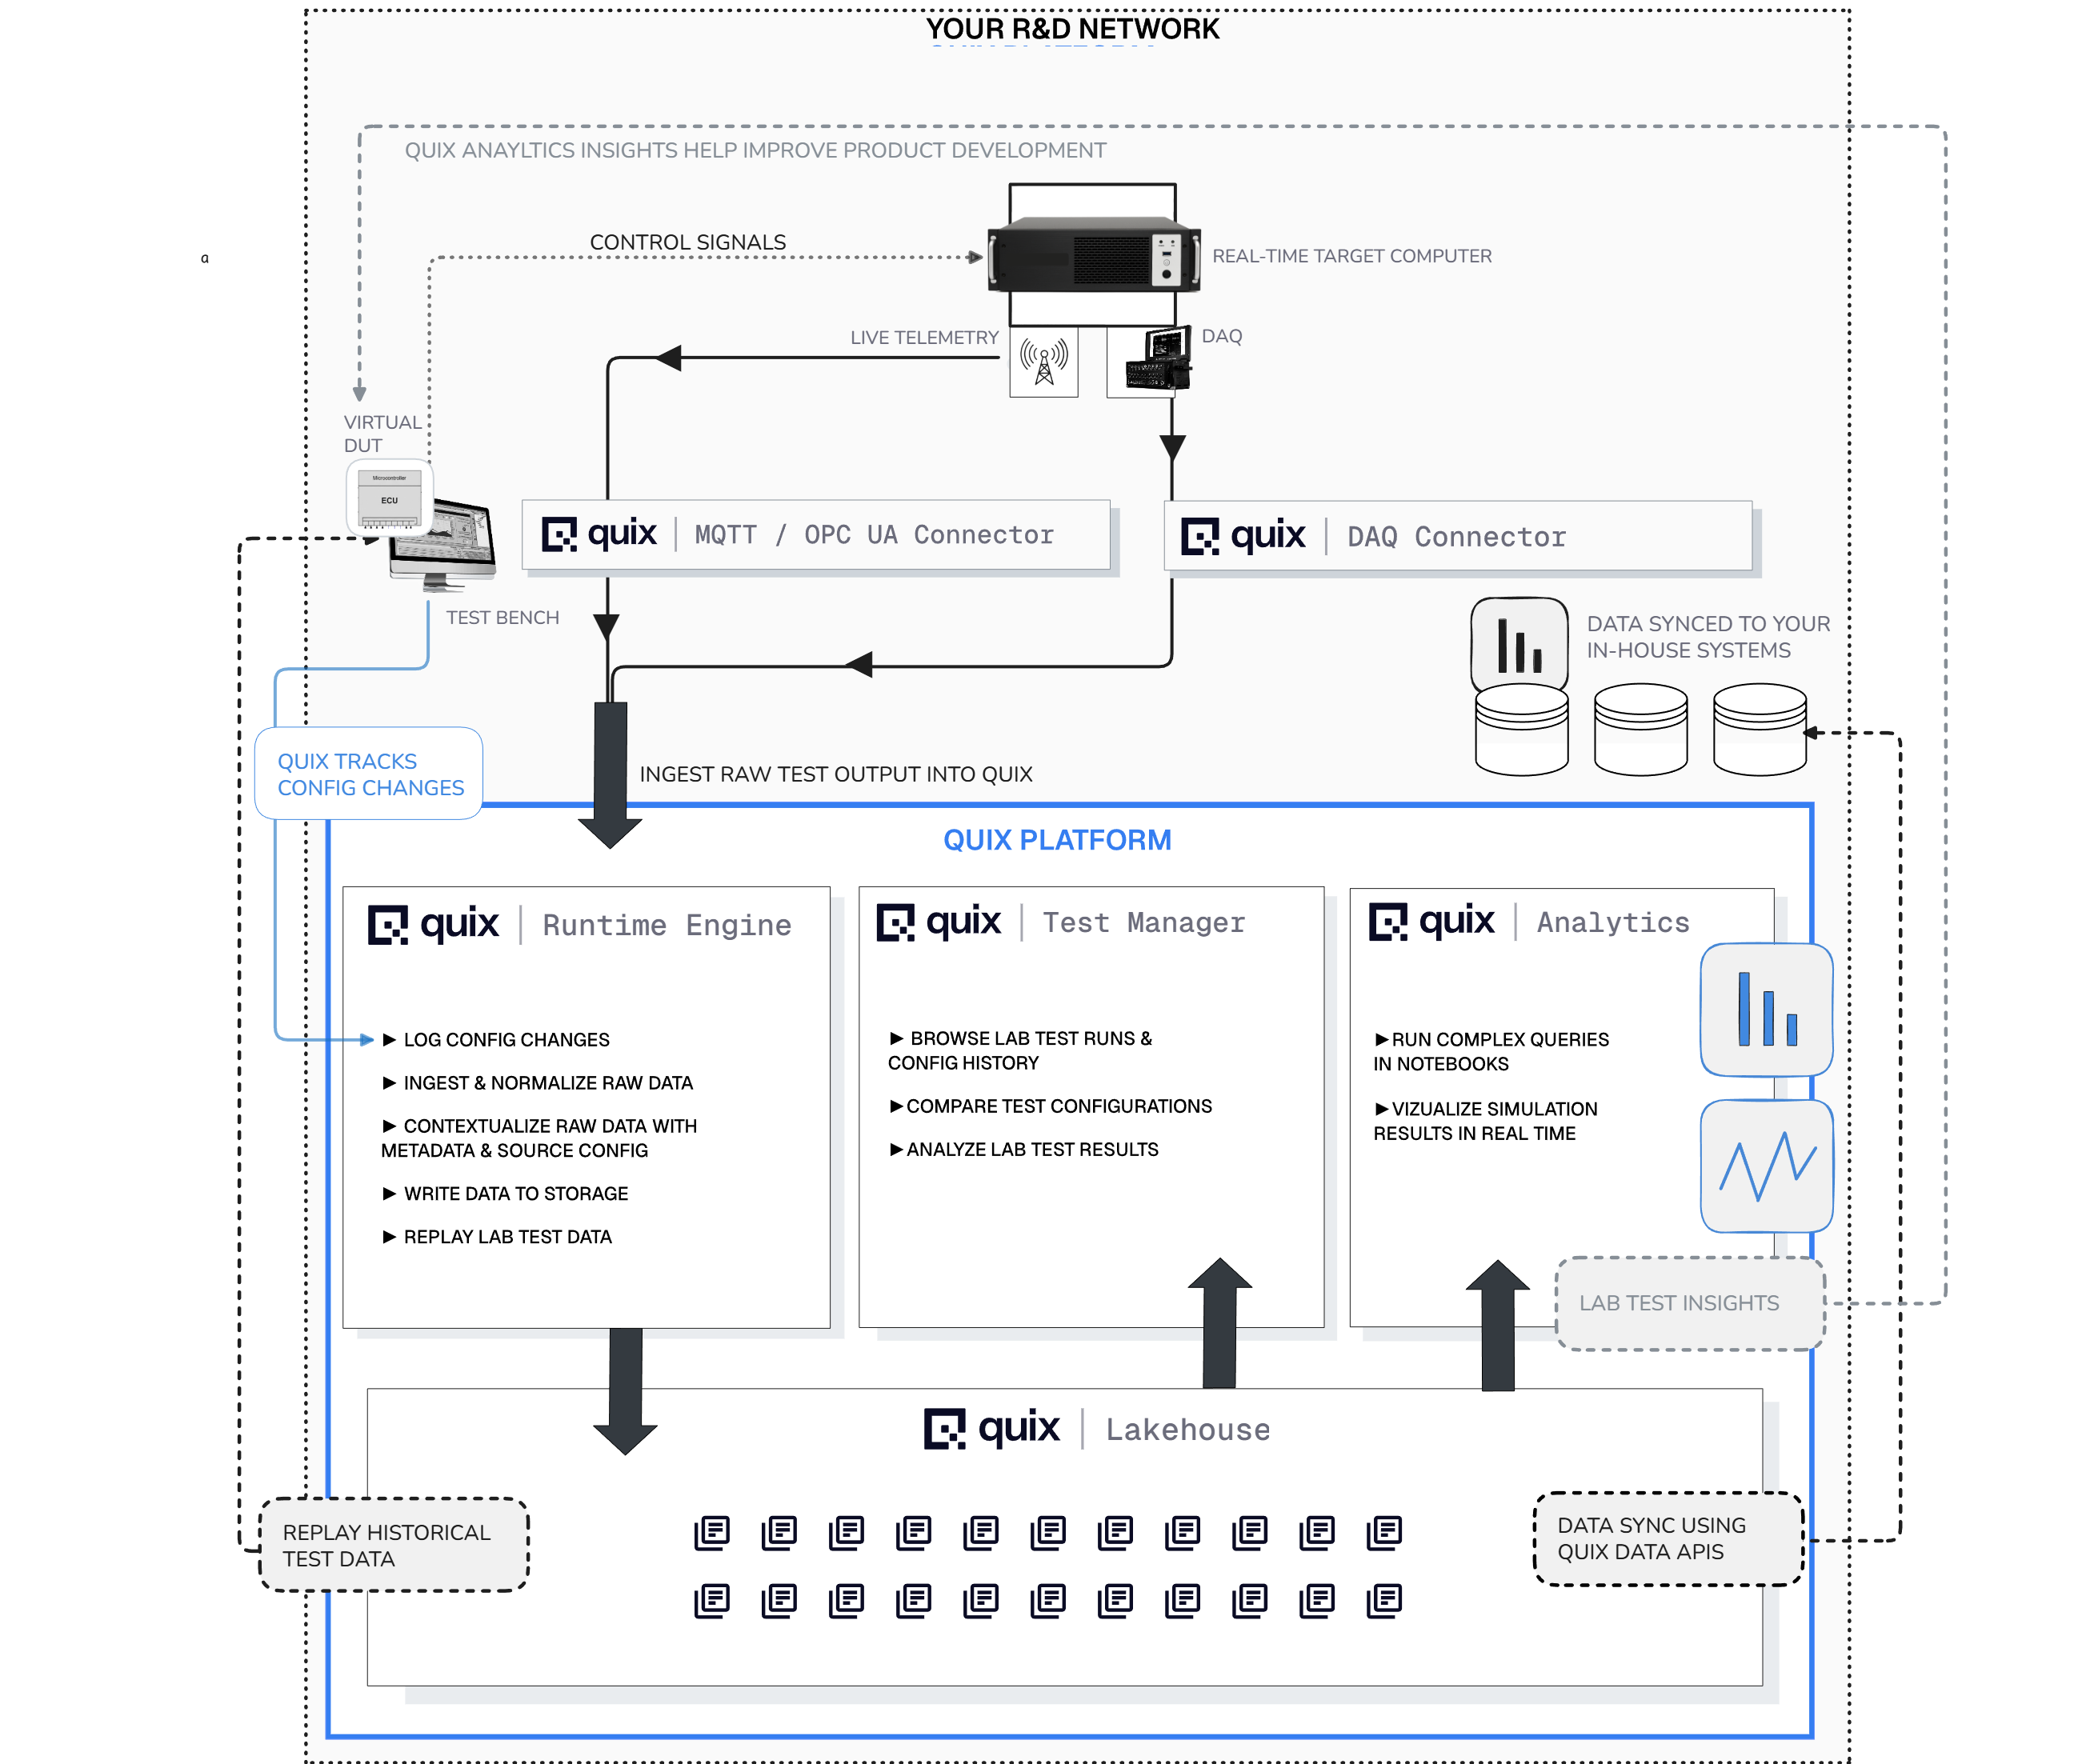
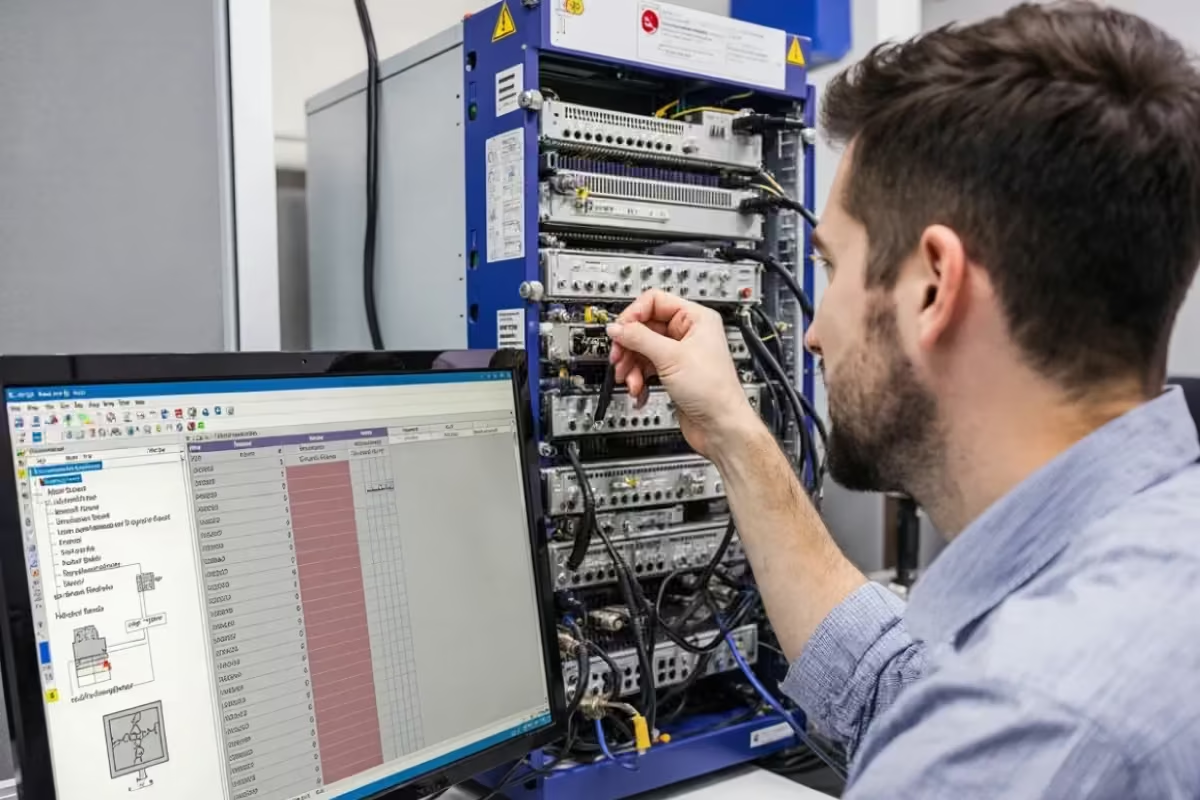
Parallel test data capture and coordination
Collect and manage results from multiple HIL rigs at once. Quix keeps each test’s configuration, firmware, and data synchronized and comparable, so engineers can analyse parallel sessions without manual merging.
Automated post-processing and normalization
Stream high-frequency measurements directly into Quix, where data is timestamp-aligned, cleaned, and enriched with its configuration context — ready for analysis as soon as each run completes.
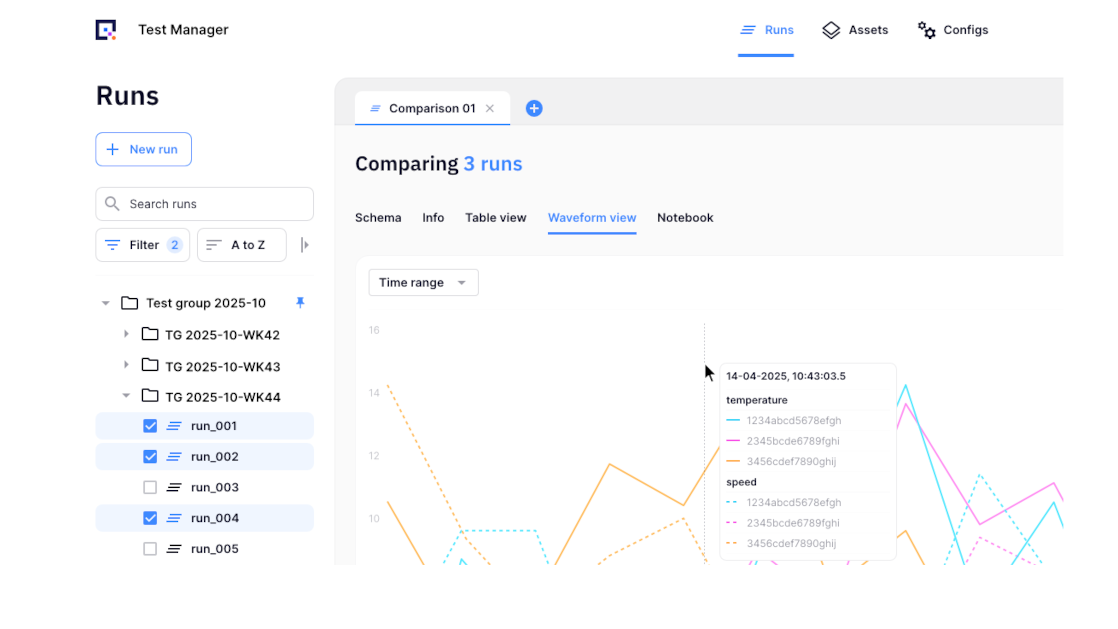
Live dashboards and analysis notebooks
Monitor controller and sensor performance in real time using Grafana dashboards, or analyze historical runs in Python notebooks — all connected to the same live data store.
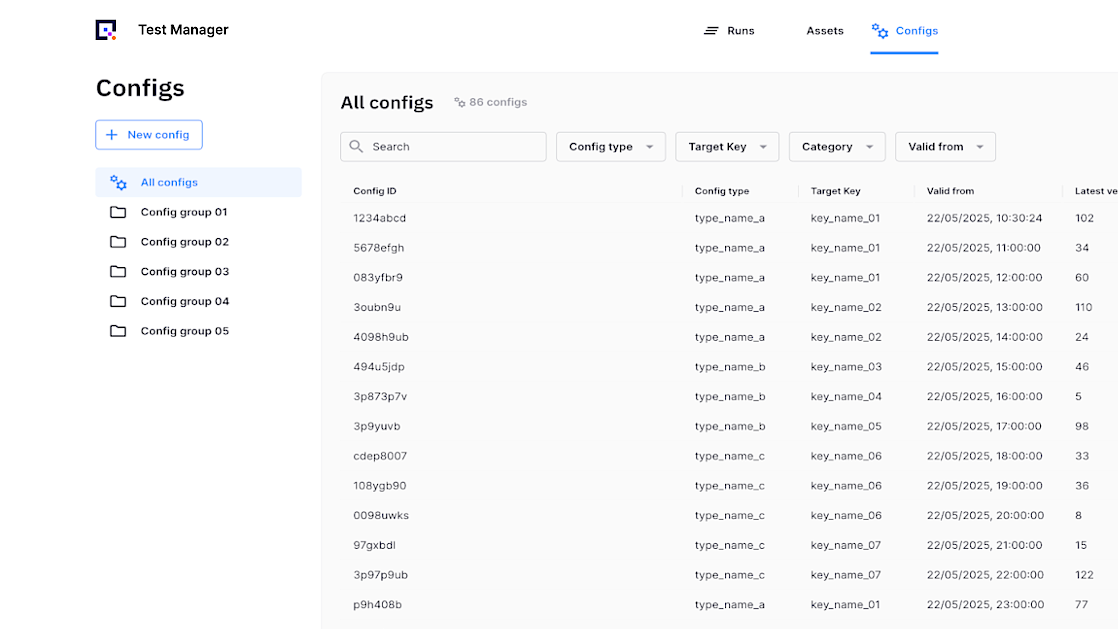
Test campaign tracking and versioning
Automatically record every HIL run with its firmware, controller, and model versions. Compare historical campaigns to understand how software or hardware changes affect performance.
Cost efficient data storage
Use the Lakehouse paradigm to store data in a variety of formats and resolutions without sacrificing accessibility or IT budgets.