Predict 3D printer failures in real-time using sensor data
Deploy a reference application that shows you how to do real-time predictive analytics on sensor data from a simulated fleet of 3D printers.
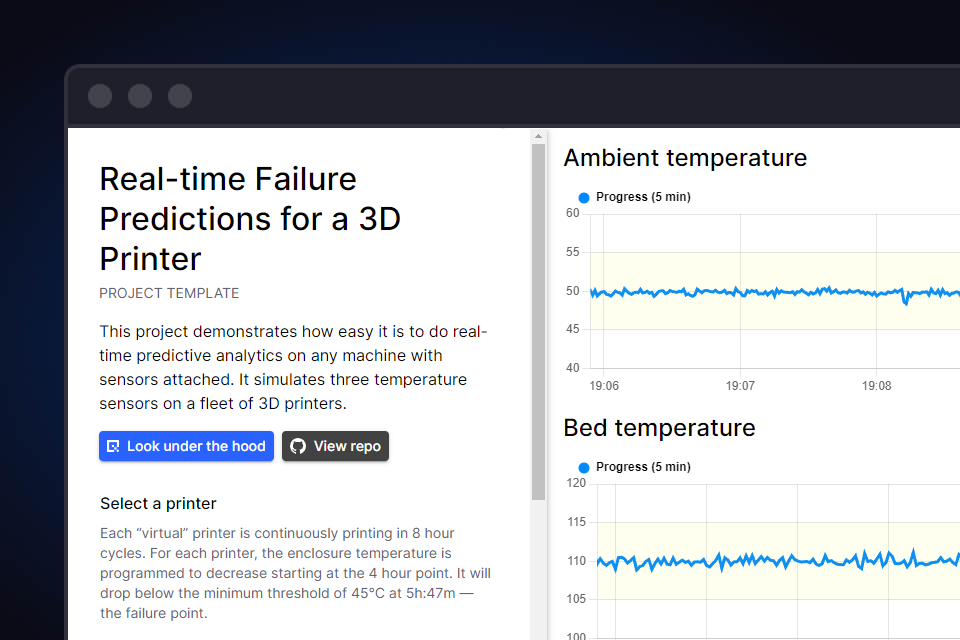
For any business that relies on machines, regular maintenance is crucial since it helps avoid unexpected machine breakdowns, ensuring smoother, more efficient operations. It helps save costs too, because emergency repairs are usually more expensive than scheduled repairs.
The traditional way to maintain machines was to schedule regular checkups and construct maintenance plans. However, this process is time consuming and not an exact science.
These days, machines are monitored by a myriad of sensors so it's possible to do predictive maintenance based on patterns in the sensor data. If you’re completely new to the concept of predictive maintenance, checkout InfluxDB’s article “A Guide to Predictive Maintenance and Machine Learning” which is a great primer. Here, I'm assuming you know what it is in theory, but you’re not sure how to get started.
Indeed, implementing predictive maintenance can be challenging. The practice requires you to have a robust data collection pipeline in place. And you also need data scientists to help you with the forecasting and data analysis. This transition to a data-driven approach is often a huge step for companies that specialize in manufacturing and mechanical engineering. Even if they have in-house development teams, those developers probably specialize in building firmware and embedded systems rather than crunching huge volumes of sensor data.
Thus, to help make predictive maintenance more accessible to newcomers, we’ve created a simple project template and hands-on tutorial to help you understand how it works in practice. The idea is to simulate data coming from a fleet of 3D printers and predict which ones are going to fail before the print is finished. Once you’re familiar with the template, I’ll show you how to bring in external data with the MQTT protocol.
The predictive maintenance dashboard
The following screenshot is from a live demonstration of the template. It shows you the real-time telemetry from the various temperature sensors as well as alerting you to various anomalies.
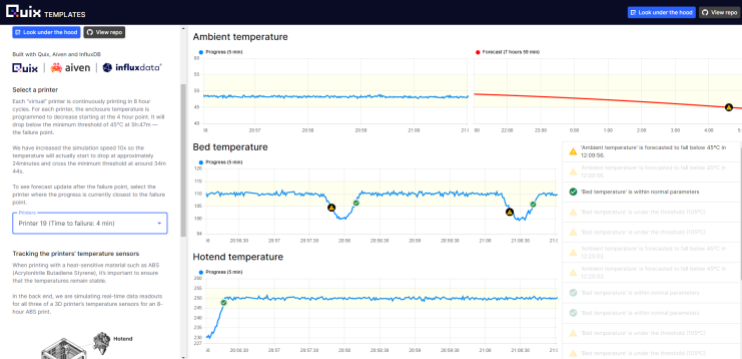
To see this demonstration live, open the following URL:
https://dash-demo-predictivemaintenance-dev.deployments.quix.io
It might take a few seconds before you start seeing data come through.
Back end architecture
The following diagram shows how data flows from the data generator service (bottom left) to the printer dashboard service (top-right)
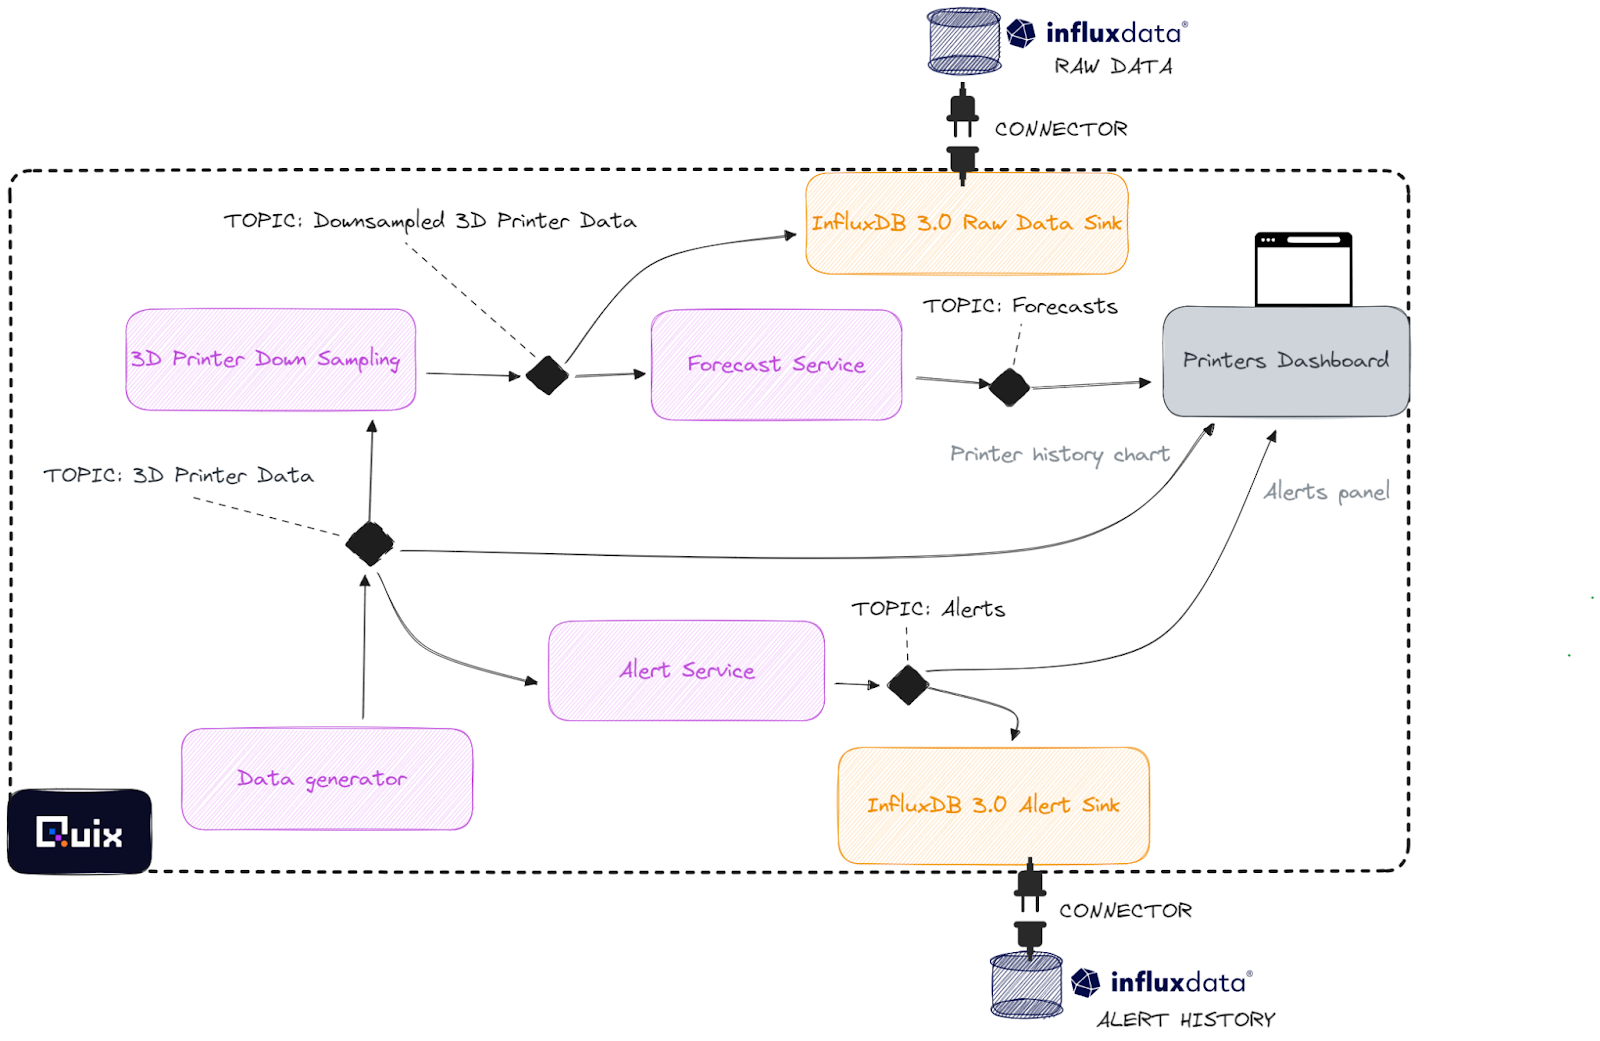
The data generator is simulating various temperature sensors on a fleet of 3D printers. That sensor data is then downsampled before it is fed to a forecasting algorithm (so that it runs more efficiently). The raw sensor data is used to detect any unusual spikes or dips which will generate alerts. Optionally, both the downsampled sensor data and the alert history can be archived to InfluxDB if you activate the corresponding connectors.
However, the best way to understand how this project works is to create a copy of the project yourself and play around with the logic.
To make a copy of the project, you’ll need to fork the GitHub repo and follow a few steps in the Quix portal. I’ll get to the detailed steps in a minute, but first, you’ll need:
- a free Quix account — if you haven’t created one yet, you can sign up now (you can do it in a few clicks with an existing Google, GitHub or Microsoft account).
- a GitHub account.
- (optional) a free InfluxDB Cloud account.
The demo includes connectors to InfluxDB Cloud Serverless so that you can persist the generated data and use other Dashboard tools such Grafana to visualize it. However, you don’t need InfluxDB to complete the tutorial.
Getting your own copy of the project
There are a few major steps to getting your own copy of the project:
- Fork our predictive maintenance repository from GitHub.
This will make it easy for you to customize your version of the project but still benefit from upstream improvements.
- Create a project in Quix Cloud, create a new development environment and link it to your fork
This will allow you to run and update the application in Quix Cloud under your own account.
- Update the credentials for the Project Frontend (and InfluxDB Cloud if you want use InfluxDB)
When forking a project template, app secrets such as API keys and database credentials are not transferred into project copies so you’ll need to add these yourself.
After you have the basics set up, we’ll dive into the code and look at how you can adapt it.
Forking the repository
To get a handle on the code, let’s first fork the predictive maintenance repository. Why fork rather than clone? Because, later you’ll be bringing that code into your own Quix environment and using a fork is the easiest way to keep your environment synchronized. You’ll also be able to get any upstream changes we make to the project template.
If you already have a GitHub account with lots of repos, you might want to create a specific Git user for this project. Later you’ll be giving Quix SSH access to the repository and having a separate user is a good way to ensure that Quix does not have more access than it should.
- In your web browser, log in to GitHub and open the Fork page for the predictive maintenance repository.
- Adjust the repo name if you like, and click Create Fork.
Creating a new development environment in Quix
Before you can create an environment in Quix, you first need to create a project. During the project creation wizard, you’ll then be asked to add an initial environment. You can add more environments later once you get the hang of things.
To create a project and connect an environment to your forked repo, follow these steps:
- Open Quix and create a new project.
- If you have an existing Quix account, log in and click + New project.
- If you don't have a Quix account yet, create an account and, when prompted, choose the Advanced 5-click project creation wizard.
- When prompted for a project name, enter “Predictive maintenance tutorial” (or something similar) and select Connect to your own Git repo.
- On the next screen, you should see some instructions on how to add the Quix SSH key to your repo—follow those instructions.
Adding this key enables Quix to automatically synchronize your repo with the Quix environment.

- On the next screen, you’ll be asked to create an environment—environments enable you to deploy code from different branches in parallel.
Enter ‘tutorial’ for the environment name and select the ‘tutorial‘ branch from your forked repo.
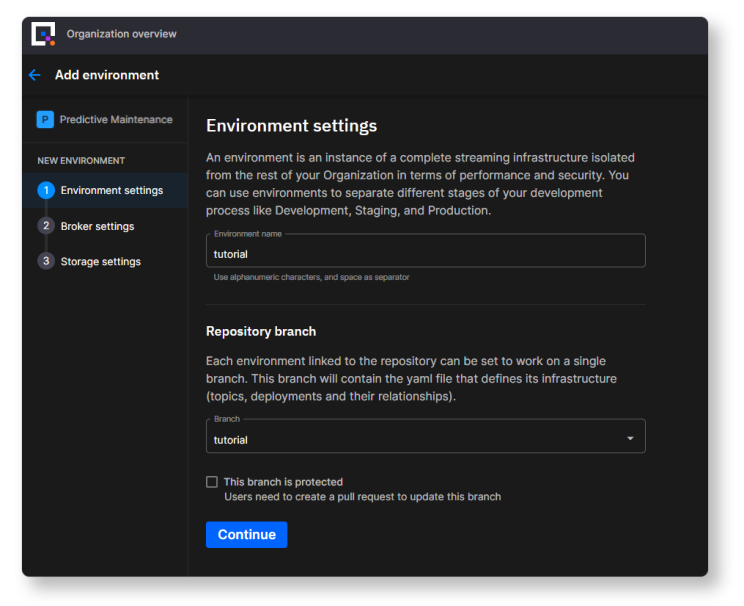
If you want to use this repo in production it’s advisable to set the branch as protected so that others don’t commit directly to the main branch and are required to use standard Git review procedures.
- Continue through the next steps in the project creation wizard.
- The wizard will ask you which message broker you want to use.
The original version of the project uses Aiven for Apache Kafka as a message broker.
- If you want to use Aiven too, you’ll need to have an account first—in which case you would select the Aiven option and enter your credentials. If you don’t have an Aiven account yet, open the sign up page to register for a free trial. Make sure that the user you create there has permission to create topics.
- Otherwise, if you just want to get started quickly, you can also stick with the default Quix managed broker.
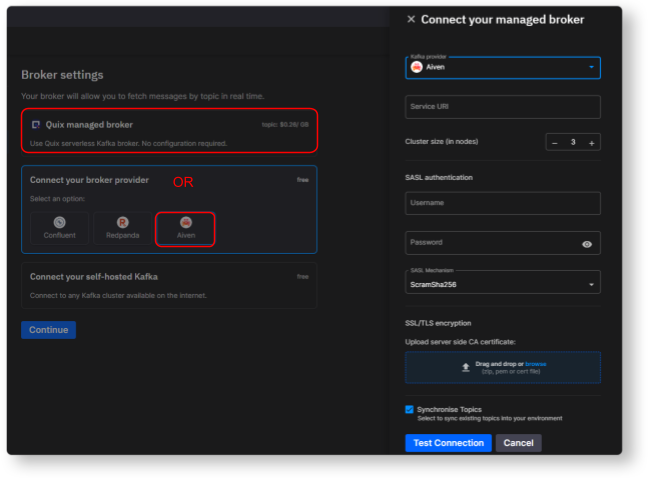
- Continue through the next steps in the project creation wizard and keep the default storage settings.
- If it’s not open already, navigate to the Pipeline page.
You'll see a warning that your Quix environment is out of sync with the source repository (since the environment starts empty).

At this stage you might see the deployment names show up with dotted borders around them, indicating that the deployments have been configured but not yet provisioned.
Click the Sync environment button to pull the latest code from your forked GitHub repo and provision the deployments
Note, the sync process is bidirectional: if you commit and push some changes to your repo from your local machine, Quix will automatically pull those changes. And likewise, if you commit some changes within the Quix IDE, it automatically will push those changes back to your GitHub repo too.
Hopefully the sync was successful. If it worked, you should see all your deployments get provisioned on the Pipeline page. The deployment panels should now have solid borders rather than dotted borders. They don’t start automatically though. You need to start them manually after you add the required application credentials.
For example, the services that connect to InfluxDB Cloud will fail if you try to start them before you’ve configured your InfluxDB Cloud credentials—but don’t worry, we’ll get to that in a minute.
First, let’s take a look at how the project is structured.
Looking under the hood
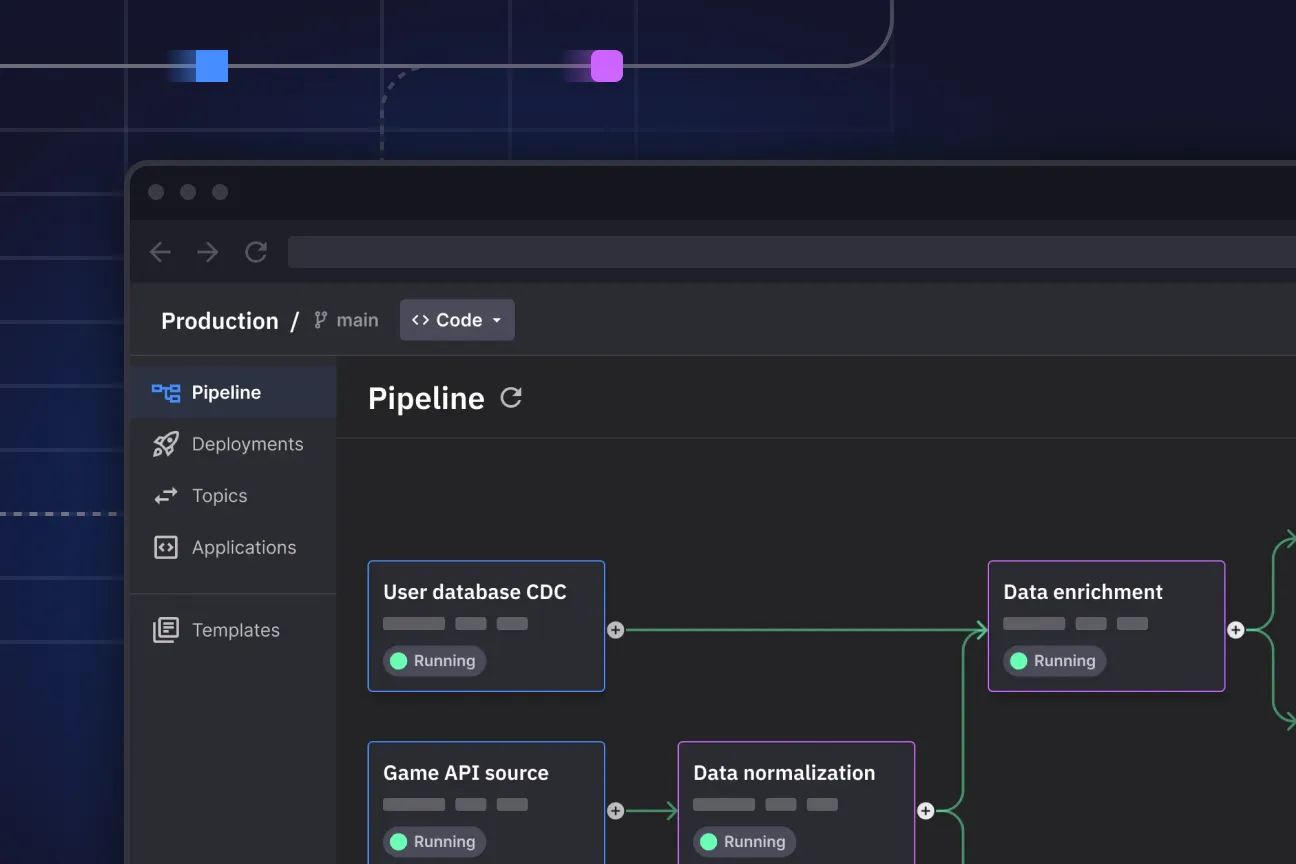
When you open the Pipeline page in Quix, you’ll see a visualization of how the different back end services are interconnected.

Each service writes to a topic which the next service then reads from. The topics are thus the “glue” that connects the services together and are represented as lines leading from one service to the next. If you mouse over a line, you’ll see the name of the connecting topic provided as a tooltip.
For this tutorial, I won't spend too much time going over the source code of each service, but you’ll find a brief description and links to more information in the following reference table.
Back end component reference
If you click the component name you can see the actual service running in a Quix read-only environment including the runtime logs and data lineage.
Generates data that simulates the temperature sensors on a fleet of 3D printers. The simulation includes data for the hot end, the bed, and the ambient temperature.
Publishes samples of the raw data for more efficient downstream processing. The downsampled data is used by the forecasting service.
Generates a forecast for the ambient temperature based on the downsampled data using a quadratic function.
Publishes the raw data to an InfluxDB 3.0 data store.
Publishes alerts to a topic for the dashboard to display in the printer dashboard or to pass to any downstream altering systems.
Publishes the alerts to an InfluxDB 3.0 data store.
The main user interface of the project. Displays ambient temperature, hot end and print bed temperatures as well as a forecast for the ambient temperature for the selected printer.
In this tutorial, I want to focus on showing you how to customize the project for your own requirements.
Customizing the project
The first step to customizing the project is adding your own app secrets. First, you’ll need to generate your own bearerToken so that your printer dashboard can connect to the Quix backend. If you want to try writing data to InfluxDB Cloud, you’ll also need to set up your own database and use your specific InfluxDB credentials.
Adding the required secrets
Let’s start with the bearer token. Front end clients need to use one of the Quix APIs to pull data but to get that data, they must first authenticate using a bearer token. In this project, the Printer Dashboard needs to read data from the topics ‘3d-printer-data’, ‘forecast’, and ‘alerts’. To allow the Printer Dashboard to authenticate with the Quix API, you’ll create a Personal Access Token (PAT) that you can configure as the bearerToken.
Getting a personal access token
Here’s how you get a personal access token in Quix.
- Open your profile menu on the top-right, and select Personal Access Tokens.
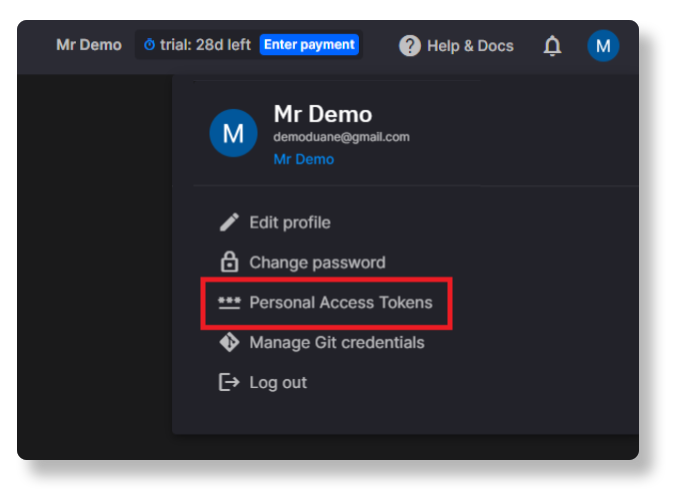
- In the dialog that appears, click Generate token, fill in the form, then copy and paste your personal access token to notepad or any other temporary storage location—you’ll need it for the next step.
Configuring the bearerToken as an application secret
You can now enter the PAT as a value for a new app secret called ‘bearerToken’.
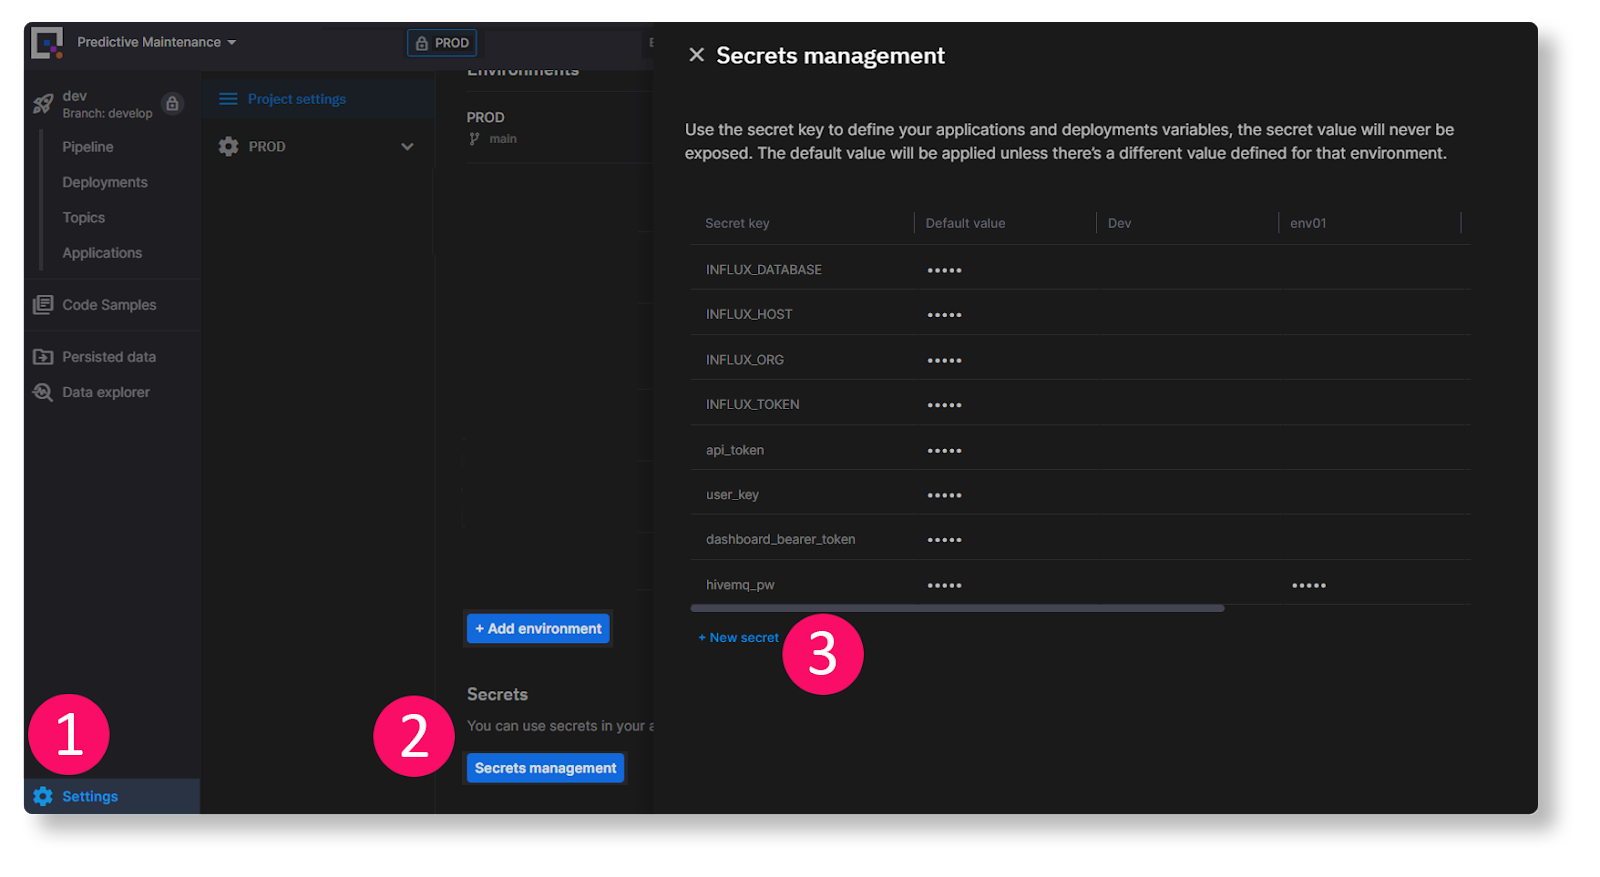
To add an app secret, follow these steps:
- Click the Settings button [1], then click Secrets management [2].
- In the panel that appears, click + New secret [3], and enter “bearerToken” as the Secret key.
- In the “Default” and “Tutorial” columns, paste your personal access token that you created in the previous step as the value in each cell.
Adding your own app secrets to store the InfluxDB Credentials
If you want to use InfluxDB to store the generated data, repeat the same process above for the InfluxDB Credentials.
Check the Predictive Maintenance Dashboard

You should see your own copy of the dashboard which shows the same real-time printer statistics, forecasts, and just like the demonstration version.
Ok, so how could you extend this example? One idea is to make the data ingestion a little more realistic. Right now, data is being generated from within Quix, but in a real-world scenario the data would be ingested from an outside source, commonly via the MQTT protocol.
Let's try to ingest some data from an external 3D printer. If you don't have an actual 3D printer lying around, don’t worry. In the following section, I’m going to show you how to send data to Quix with OctoPrint— a popular 3D printer controller application by Gina Häußge. It includes a Virtual Printer which you can use to virtually “print” any Gcode file you like.
Ingesting External Data via MQTT
OctoPrint enables you to remotely control and monitor every aspect of your 3D printer and your printing jobs from your browser. It also has a powerful plugin system that allows you to extend its functionality. In this section, I’ll be showing you how to install and use the MQTT plugin to send data to Quix via an MQTT Broker.
The MQTT broker I’ll use in this example is HiveMQ—an enterprise-grade MQTT platform that is popular in the IoT industry. Their cloud offering is easy to use and includes a free trial.
Here are the major steps I’ll be going through. Note that I won't explain everything in beginner-level detail because I’m assuming that you have some experience with IoT devices.
Setting up HiveMQ
- Signing up
- Getting your Cluster details
Setting up Octoprint
- Install Octoprint
- Enable the virtual printer
- Install and configure the MQTT plugin
Setting the Connection to Quix
- Using the MQTT Connector
- Extracting the right data
Setting up HiveMQ
To set up HiveMQ, follow these steps:
- Open the HiveMQ Cloud page and click Sign-up free.
- Complete the sign-up wizard and configure a user for your cluster—note down the username and password),
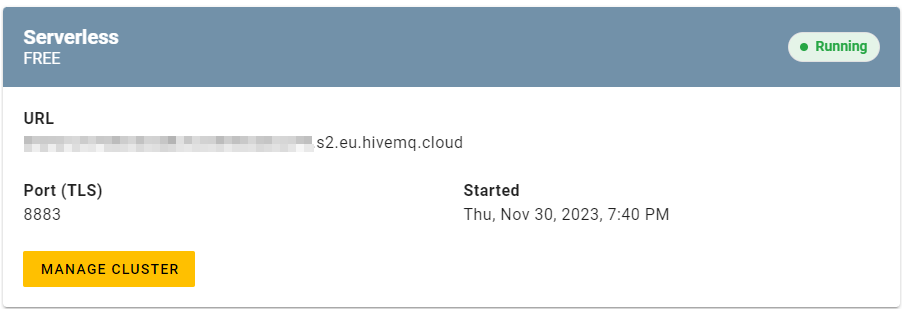
- Open the console, navigate to the clusters page and note down the URL and port for your free serverless cluster.
Setting up OctoPrint
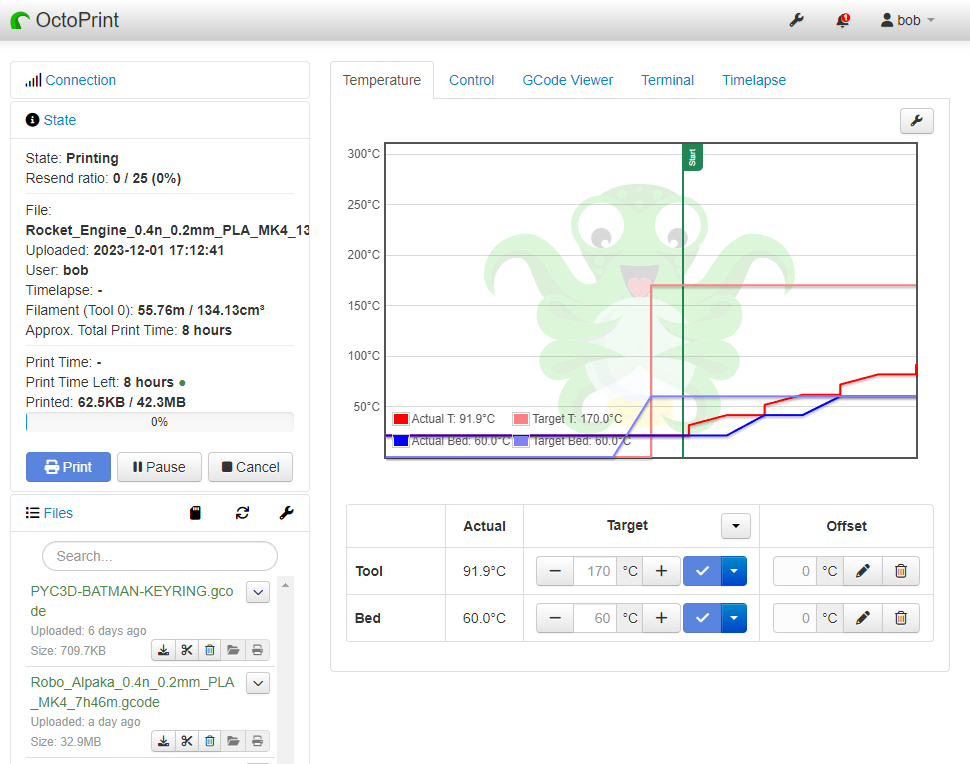
To install OctoPrint, follow the installation instructions for your system. In my case, I wanted to install it on my Windows machine and use the virtual printer. Thus, I installed it into a virtual Python environment with the following command:
When you start the server for the first time, it will take you through some configuration steps, then you’re go to go.
Enabling the virtual printer
According to the documentation, you can enable the virtual printer via the config.yaml file, but I wasn’t sure where to find it on my system.
I eventually located it at `C:\Users\myuser\AppData\Roaming\OctoPrint\config.yaml`, set enabled to true and restarted the octoprint server,
Installing and configuring the MQTT plugin
Click the wrench icon

at the very top of the page to open the OctoPrint settings, then click Plugin Manager on the left-hand nav.
On the Plugins page, click +Get More, and in the dialog that appears, enter the following URL in the “...from URL” field and click Install.
https://github.com/OctoPrint/OctoPrint-MQTT/archive/master.zip
After that’s done, you might need to restart the server again, then navigate to the MQTT plugin settings, which you’ll find in the left-hand navigation, of the main OctoPrint settings dialog
Remember HiveMQ access details you noted in the previous step? Enter those in the MQTT plugin settings (host, port, user name and password). Make sure you select the option “The broker requires TLS to connect”.
Running a (virtual) print
If you have a real printer connected via a Raspberry Pi, you can obviously choose your real serial port, otherwise select VIRTUAL from the Serial Port menu and click Connect (Connection panel in the top-left of the OctoPrint home page).
Now you’re ready to print. Because I was using a virtual printer, I downloaded a test gcode file from the Prusa website (Robo Aplaca). If you’re using a real 3D printer you should obviously use the gcode from your own slicer.
Upload the file to OctoPrint and start the print. You should start to see the (virtual) temperature sensors generating data.
To make sure data was coming through to HiveMQ, I used MQTT Explorer.
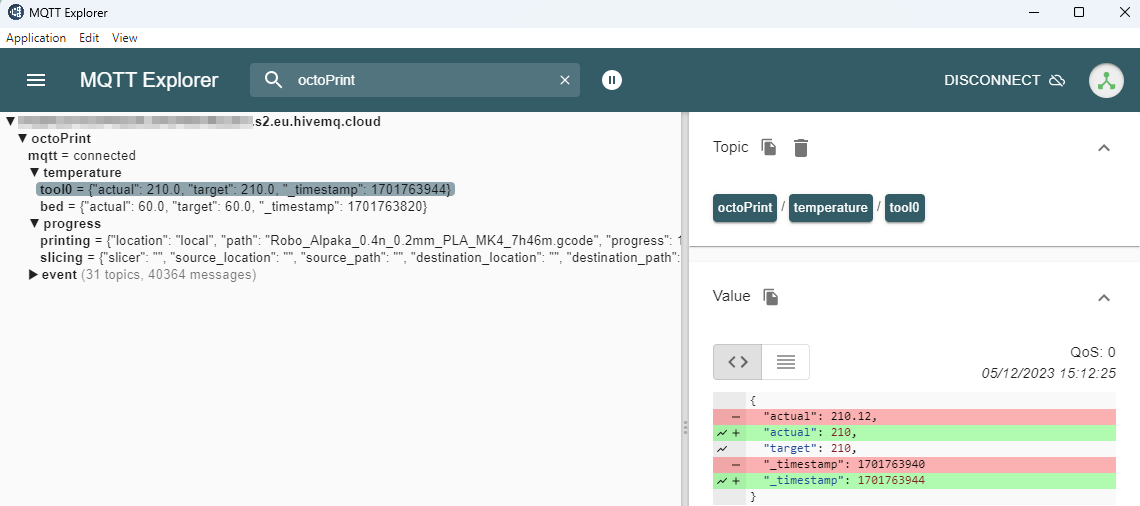
The temperature comes through on the topic octoPrint/temperature/tool0 but it doesn’t change that often once it stabilizes. When browsing the virtual printer’s configuration parameters I couldn’t figure out how to fluctuate the temperature and keep sending it, so I chose another topic to monitor.
In fact, the topic that changes the most is octoPrint/event/Zchange which is understandable because the virtual print head is constantly moving. So that’s the one I decided to read from in Quix.
Ingesting MQTT messages into Quix
For the time being, let's send the data to a distinct topic so we can work on it separately from the rest of the project. Go back to your version of the predictive maintenance project in Quix and open the Topics page. Click Add new, then call your new topic “mqtt-data” or something similar.
Then, open the Applications section and click +New Application. You’ll want to add the MQTT code sample as a source connector. If you get lost, refer to our documentation on creating an application and using code samples.
In the MQTT sample, configure the connection details to your HiveMQ cluster. Note that you might have to delete and recreate the mqtt_password field as a plain text variable or preferably as an application secret. Then, enter octoPrint/event/Zchange for the variable mqtt_topic and select mqtt-data as your output topic in Quix.
Once you’re done with the configuration, deploy the application as a new service (stick to the default settings for now). After the service has started, head back over to the Topics page, and click the row for the mqtt-data topic to open the live data preview. Click the Messages tab to make sure that messages are coming through. If you’re not getting any data, try running the MQTT code locally using a streaming token (remember to set local environment variables with an .env file).
When you navigate to the live data preview for the mqtt-data topic, you should see messages coming through like this:
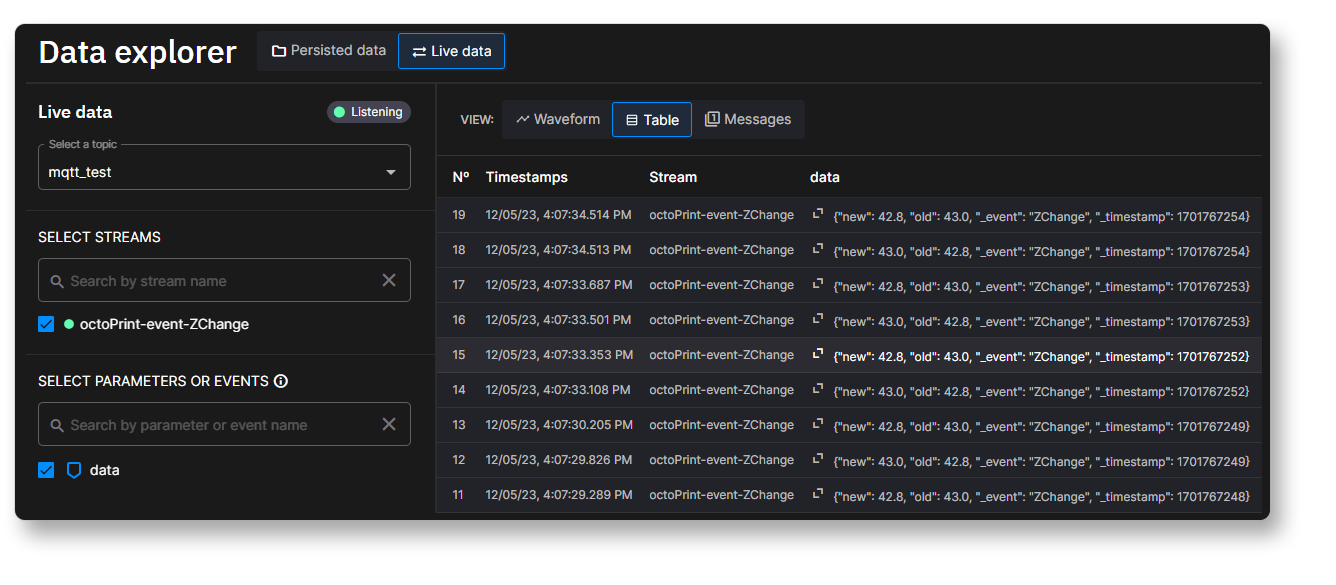
Note that the data column shows a JSON payload rather than a distinct value. In this case we want to get just the “new” location of the print head and extract that value from the payload.
To do so, you can make a few tweaks to the file mqtt_function.py from the original code sample. Update the handle_mqtt_message function so that it resembles the following example:
This code has been updated to convert the payload from HiveMQ to a Python dictionary and to access the value of “new” from the dictionary.
Save your changes and redeploy the service. You should now see the newest ZChange coming through as a distinct data point called “new”.
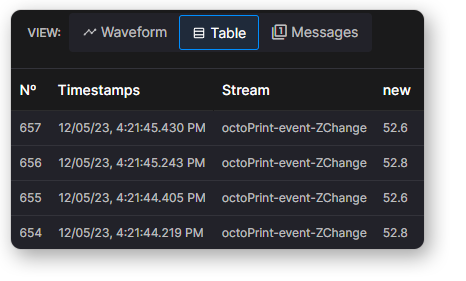
Once you have this data point, you can use the Quix Streams library to do further processing like we have done for the generated data.
If you ran into any difficulty following this exercise, don't hesitate to post a message in the Quix Community Slack channel and one of us should get back to you—typically within an hour.
Conclusion: IoT data processing in the cloud
If you managed to successfully complete the exercise, congratulations. You have just set up the fundamentals of modern IoT data processing architecture as illustrated in the following diagram.
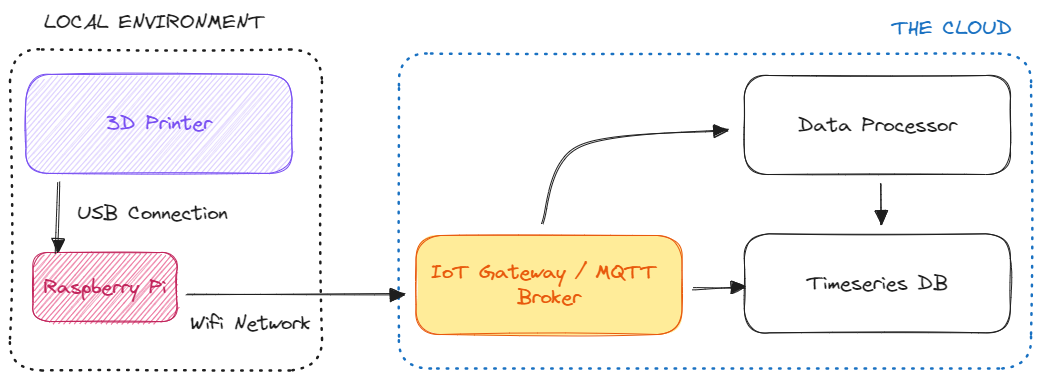
In this pattern, an embedded device (in this case a 3D Printer) sends data to a gateway in the cloud (via a Wifi or mobile data connection) and that data is routed to specialized services for archiving and processing. However, the architecture for connected cars or robots on an assembly line would look very similar although there may be differences relating to what runs in the cloud. For security reasons, some companies might choose to run all of the cloud components on a private network instead.
Indeed, in our example, we ran HiveMQ, Quix, and InfluxDB processes all in serverless instances managed by the respective vendors. Although this removes the headache of managing the compute and storage resources for each tool, it may not suit everyone. Thus, you also have the option of running each of these tools in your own virtual private cloud (or bare metal servers if you’re feeling really hands-on).
Regardless of when you run it, this architecture gives the fundamentals of the robust data processing pipeline I mentioned at the beginning of this article. Once you have this pipeline in place you are in a great position to make predictive maintenance work for your business (just don't forget to hire those data scientists).
- For more questions about how to set up this architecture with Quix, InfluxDB and MQTT brokers, join our Quix Community Slack and start a conversation.
- To learn more Quix Streams, check out the relevant section in the Quix documentation.
To see more project template demos, check out our template gallery.

Check out the repo
Our Python client library is open source, and brings DataFrames and the Python ecosystem to stream processing.
Interested in Quix Cloud?
Take a look around and explore the features of our platform.
Interested in Quix Cloud?
Take a look around and explore the features of our platform.

.svg)


