.svg)
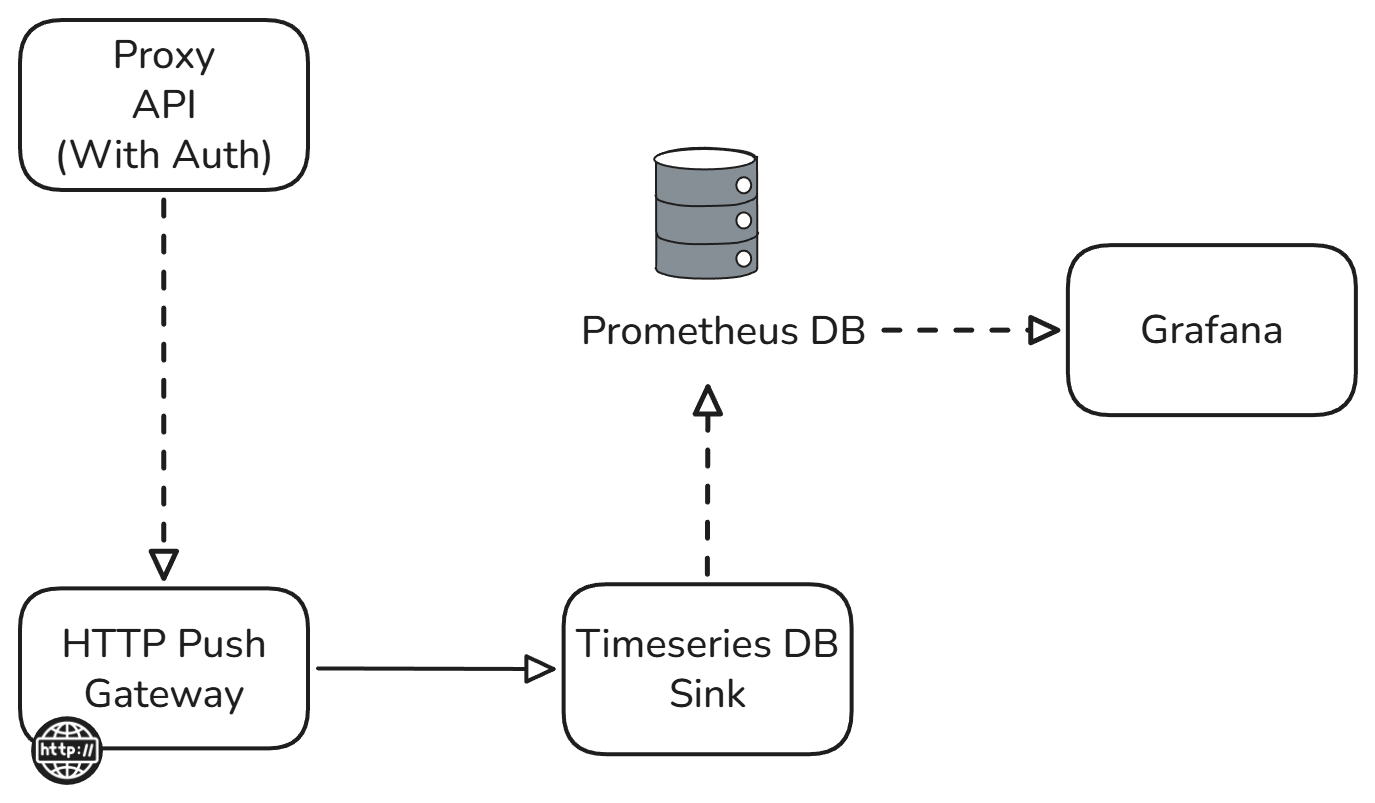
Application level monitoring pipeline reference architecture
Your battery management system just threw an error during a critical validation test. Your drone's flight controller is acting up during the final prototype evaluation. Your HVAC system's performance metrics are drifting, and you need to know why. Sound familiar? When complex electro-mechanical systems fail, every second counts in identifying the root cause.
Traditional monitoring approaches weren't built for today's sophisticated R&D environments. You're dealing with applications that generate massive volumes of real-time data, but your current tools force you to hunt through scattered logs, piece together fragmented metrics, and manually correlate events across multiple systems. The result? Engineers waste precious time tracking down issues instead of solving them.
About the reference architecture
The Application Level Monitoring Pipeline Reference Architecture provides a complete, pre-configured solution for monitoring applications in real-time R&D environments. This reference architecture centralizes application metrics, logs, and performance data into a unified monitoring infrastructure that scales with your development needs.
Unlike generic monitoring tools, this architecture is specifically designed for the unique challenges of R&D environments. It handles the high-frequency data streams from embedded systems, manages the complex metadata from test configurations, and provides the real-time visibility you need when validating critical system behaviors.
The architecture consists of four core components working together seamlessly. A Proxy API with authentication manages secure access to your monitoring data. An HTTP Push Gateway collects metrics from your applications and forwards them through Kafka topics to a Time series Database Sink for persistent storage. A Prometheus database stores the time-series data, while Grafana provides real-time visualization and alerting capabilities.
Why current monitoring approaches fail R&D teams
Modern R&D teams face monitoring challenges that traditional IT solutions simply can't handle. Your rocket engine test produces 50GB of telemetry data per test run. Your autonomous vehicle prototype generates thousands of sensor readings per second. Your battery cell validation requires tracking voltage, temperature, and current with microsecond precision.
But here's where it gets messy. Each application in your system probably has its own logging format, its own metric collection approach, and its own way of reporting errors. When something goes wrong during a critical test, you're left scrambling through multiple dashboards, trying to piece together what happened across different systems.
The traditional approach of checking individual application logs doesn't scale when you're dealing with distributed systems. Your drones flight controller, navigation system, and sensor array all need to be monitored simultaneously. When an issue occurs, you need to see the complete picture instantly, not spend hours correlating timestamps across different log files.
Manual monitoring becomes impossible when you're running multiple test scenarios simultaneously. Your team might be validating three different battery configurations, testing two HVAC control algorithms, and running validation tests on a new motor controller all at the same time. Each test generates its own stream of application-level data that needs real-time monitoring.
Real-time monitoring that scales with R&D workloads
This reference architecture transforms application monitoring from a reactive process into a proactive capability. Instead of hunting down problems after they occur, you get real-time visibility into application behavior as it happens.
The architecture uses a push-based approach that scales naturally with your R&D workload. Applications send metrics to the HTTP Push Gateway, which immediately forwards them through Kafka topics to the Time series Database Sink. This design eliminates the polling overhead that cripples traditional monitoring systems under heavy load.
Authentication is built into the Proxy API, ensuring that sensitive R&D data remains secure while still providing the access your team needs. The system handles authentication tokens, manages user permissions, and logs access attempts without adding complexity to your application code.
Real-time data processing means you can catch issues as they develop, not after they've already impacted your test results. When your robot's servo motor starts showing irregular response times, you'll see the trend immediately in Grafana. When your electric vehicle's battery management system reports unusual cell voltages, alerts fire instantly.
The Prometheus database is optimized for time-series data, providing efficient storage and fast querying for the high-frequency metrics that R&D applications generate. Whether you're storing sensor readings every millisecond or tracking performance metrics every few seconds, the system maintains consistent performance.
Key features of this reference architecture
Scalable metric collection: The HTTP Push Gateway handles thousands of concurrent connections from your applications without performance degradation. Whether you're monitoring a single prototype or an entire test fleet, the system scales to match your needs.
Real-time processing: Kafka topics provide the message queuing infrastructure that ensures no data gets lost, even during peak testing periods. Your monitoring data flows continuously from applications to storage to visualization without bottlenecks.
Flexible data modeling: The Time series Database Sink adapts to different metric formats and data structures. Your drone telemetry doesn't need the same schema as your battery test data, and the system handles both seamlessly.
Advanced visualization: Grafana provides the dashboards and alerting capabilities that R&D teams need. Create custom views for different test scenarios, set up alerts based on complex conditions, and share insights across your team instantly.
Secure access: The Proxy API manages authentication without impacting application performance. Your sensitive R&D data stays protected while still providing the access your team needs for effective monitoring.
Persistent storage: Prometheus database retains historical data for trend analysis and performance comparisons. Compare this week's battery test results with last month's data, or analyze performance trends across multiple prototype iterations.
Code sample
Here's how applications integrate with the monitoring pipeline:
import requests
import json
import time
from datetime import datetime

class ApplicationMonitor:
    def __init__(self, gateway_url, auth_token):
        self.gateway_url = gateway_url
        self.headers = {
            'Authorization': f'Bearer {auth_token}',
            'Content-Type': 'application/json'
        }

    def send_metric(self, metric_name, value, labels=None):
        """Send a single metric to the monitoring pipeline"""
        if labels is None:
            labels = {}

        payload = {
            'metric': metric_name,
            'value': value,
            'timestamp': int(time.time() * 1000),
            'labels': labels
        }

        response = requests.post(
            f"{self.gateway_url}/metrics",
            headers=self.headers,
            data=json.dumps(payload)
        )

        if response.status_code != 200:
            print(f"Failed to send metric: {response.text}")

    def send_batch_metrics(self, metrics):
        """Send multiple metrics in a single request"""
        payload = {
            'metrics': metrics,
            'timestamp': int(time.time() * 1000)
        }

        response = requests.post(
            f"{self.gateway_url}/batch",
            headers=self.headers,
            data=json.dumps(payload)
        )

        return response.status_code == 200

# Example usage for battery testing
monitor = ApplicationMonitor(
    gateway_url="https://monitoring-gateway.example.com",
    auth_token="your-auth-token"
)

# Monitor battery cell voltage
monitor.send_metric(
    "battery_cell_voltage",
    3.7,
    labels={
        "cell_id": "A1",
        "test_run": "validation_001",
        "battery_type": "li-ion"
    }
)

# Monitor system performance
monitor.send_metric(
    "cpu_usage_percent",
    45.2,
    labels={
        "application": "battery_controller",
        "host": "test-rig-01"
    }
)
Accelerate your R&D validation cycles
The Application Level Monitoring Pipeline Reference Architecture gives R&D teams the real-time visibility they need to validate complex systems effectively. Instead of reactive debugging after tests fail, you get proactive monitoring that catches issues as they develop.
This architecture handles the unique challenges of R&D environments: high-frequency data streams, complex metadata, and the need for immediate insights during critical testing phases. The result is faster validation cycles, more reliable test results, and engineering teams that can focus on innovation instead of troubleshooting.
Ready to improve your application monitoring approach? Explore how centralized monitoring infrastructure can streamline your R&D validation processes and eliminate the bottlenecks that slow down your development cycles.
Using this template
This blueprint can be useful for the following use cases:
• R&D
• Test Chamber
• Test Run
• Simulation
• Digital Twin