.svg)
Understand test data anomalies in seconds
Quix links your time-series data to configuration records, maintenance history, and duty cycles in a single queryable system. When you spot an anomaly, the full context is already attached to the data.
The problem:
The tools you have weren't built to work together
You start every troubleshooting session with the same question: is this real, or is something wrong with my equipment? Answering that should take seconds. Instead it takes an hour of cross-referencing because your information lives in five different systems that don't talk to each other.
Your maintenance record is chat messages
Someone sends you a message about a component swap. That's your official record of it happening. Calibration dates live in a different spreadsheet. Service history is in someone's head or buried in a shared folder. When you're staring at anomalous data and need to know if a component was recently serviced, there's no single place to check.
Duty cycle tracking is a manual spreadsheet
You've been tracking serial numbers and run hours in a spreadsheet because nothing else does it. Every time a component moves between rigs or gets swapped out, you update it manually. It works when you're managing one rig. It falls apart when you're responsible for three or four running in parallel.
Your asset management tools don't integrate with your test data
You've tried the asset management tools. Maybe your company uses an ERP system, maybe a standalone maintenance tracker. The fundamental issue is the same with all of them: they track inventory and maintenance in isolation. None of them link back to the time-series data where you actually spotted the problem.
You can't rule out simple causes quickly
Your troubleshooting has a natural order. First: is the sensor giving me real data? Second: is the component worn out, overdue for service, or past its duty cycles? Third: if the sensor and equipment check out, it's actual system behaviour and you need deeper analysis. Without linked data, steps one and two take so long that you often skip straight to three and waste time on complex analysis that turns out to be a dead sensor.
Get our latest whitepaper:
'How to Load & Analyze Engineering Data Faster with Modern Software Principles'
Learn how high-performance engineering teams architect their test data for faster analysis, and apply the same patterns to your facility.

What changes when context is built into the data

Rule out equipment issues in seconds
When you spot something unusual, you click through to the component's full record: serial number, installation date, hours run, last service event, calibration history. If the part has exceeded its rated duty cycles or was recently swapped, you know immediately. That first stage of troubleshooting (sensor check, equipment check) goes from an hour of cross-referencing to a 30-second lookup.
Duty cycles tracked automatically
Duty cycle counters are ingested alongside your sensor data and linked to component serial numbers. When a part moves between rigs, the history follows it. No more manual spreadsheets, no more guessing how tired a component is. Maintenance teams can see what's coming up for service on a dashboard at shift handover.
Scales as your facility grows
You can keep the configuration of one rig in your head. When you're running multiple rigs with different products in parallel, you can't remember which serial numbers are installed where, which components were serviced last week, or which rig had its environmental setpoints adjusted. Quix tracks all of it automatically, so your troubleshooting speed stays the same whether you're managing one rig or six.
Investigations preserved for the next person
When you investigate an anomaly and find the root cause, that analysis lives alongside the data. Two years from now, when someone sees a similar pattern, they find your previous investigation instead of starting from scratch. The knowledge stays with the facility, even when people move on.
How it works
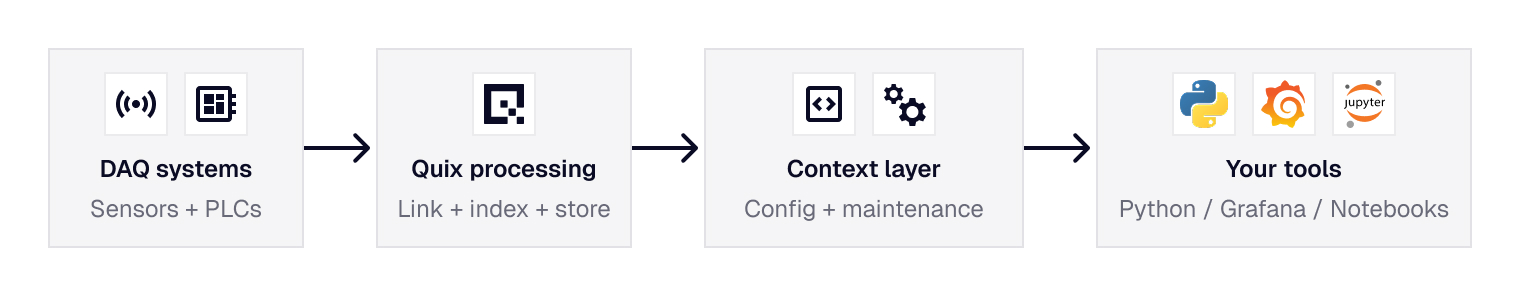
Quix captures the full configuration state at the start of every test run: serial numbers installed, software version, rig settings, environmental setpoints. Service events, component replacements, and duty cycle counters are ingested alongside sensor data. Everything is stored as structured metadata attached to the time-series, so you can query across your full test history ("show me every run where this parameter exceeded threshold on rig 3 in the last six months") and get results in seconds.
Your existing analysis tools stay in place. Quix makes them more effective by ensuring the data arrives pre-indexed with context attached. If you work in Python, Grafana, Marimo Notebooks or custom dashboards, your workflow stays the same.
Trusted by data-intensive R&D teams at:


Low risk, fast time to value
Expert consulting included
Many engineering teams don't have software expertise in-house, which is why Quix includes hands-on technical consulting to get you up and running. We can also run workshops to show your engineers how to build their own data tools.
Get a working pilot in days
You don't need a 6-month business case. Get a pilot running with a small representative dataset. Show stakeholders a live demo with real query times instead of a slide deck.
Runs on your infrastructure
Quix deploys on-premise or in your own VPC. No data ever leaves your network. Once deployed, Quix operates without any connection to the outside world, which is why teams in defence, aerospace, and other regulated industries trust it.
No vendor lock-in
Quix runs on open-source technologies: Kafka, Kubernetes, standard time-series databases. If you ever need to walk away, you keep the blueprint, the code, and the skills.