.svg)
Industry insights
Mar 13, 2025
Model based development: How to manage data throughout the R&D lifecycle
Simplify your model-based development workflow with key data management practices for consolidating test data throughout the development lifecycle.


Model Based Development (MBD) is a way of engineering physical products using “virtual development and simulations.”. You probably know the basic principle already: Instead of burning budgets building hardware prototypes and running test rigs, you create virtual models of the different systems you intend to build. This could be a virtual electrical circuit, a hydraulic system, or even a full-blown energy storage unit. The model isn’t just a sketch; it behaves like the real thing, at least to the extent you need it for the design phase you’re in.
Naturally, it’s a very complex topic and hard to cover in one single article. And there are plenty of decent MBD primers online already. However, they all tend to gloss over one crucial aspect: managing and processing the data required to make MBD work.
It’s my goal to help you fill this knowledge gap and understand the systems that you need to process data effectively. The key points that I’ll cover are:
- Managing test datasets and model versions with configuration metadata
- Using modern time series databases for storing test & simulation data
- Using streaming platforms to ingest, replay and compare development and test datasets
- Orchestrating data throughout the full model lifecycle
There won’t be time to explain any of these in great detail, but I hope to give you a starting point for further research.
What is model based development?
First, I want to make sure that we’re on the same page about what the MBD life cycle looks like in my view (since everyone has their own variations).
My own experience comes from my work as a Mechanical Engineer. At McLaren Automotive, I applied MBD principles when designing heating, ventilation, and air conditioning (HVAC) systems. The process starts with requirements, for example, the “pull down time” to reduce cabin temperature from a heat-soaked condition to a comfortable passenger environment. We built physics-based models of a car's cabin and the surrounding climatic conditions. These models allowed us to test how fast we could cool down the cabin for given energy loads. Later, the models helped us create specifications for the components needed to meet the cooling requirements (e.g. compressor, heat exchanger, evaporator, condenser and airflow distribution components).
It’s easier to explain MDB with an example so I’ve chosen an Energy Storage System (ESS) as my reference use case for the rest of this article.
Model Based Development in the Energy Industry
Battery-based systems can produce a lot of data and managing that data is often complex and costly (just see this renewable energy case study for example).
To manage development work, energy systems engineers use the classic “V-model” (popular in industries where safety and compliance are critical concerns). Throughout the stages of this process, you’ll typically use different models at different levels of fidelity.
The following diagram shows the V-model as it applies to developing an ESS system and the different types of models required.

On the left side of the "V," you start with high-level models for architecture and early validation. As you move down, things get more detailed: component specifications, controller algorithms, hardware integration. On the right side, you climb back up, verifying and validating each step until your simulated system behaves like the real one would.
What is modeled at each stage in the ESS development lifecycle?
To understand the data requirements for these models, let’s take a closer look at the different levels of model fidelity.
Conceptual Models
At the start, we need to figure out if the energy storage system even makes sense. So, we throw together a conceptual model, which is basically a set of broad assumptions rather than detailed equations.
At this stage, we treat the system as a magic energy box: we define rough estimates for capacity (megawatt-hours), power output (megawatts), and efficiency (round-trip loss). No need to worry about internal voltage drops or thermal behavior—just big-picture feasibility. Will this system store enough energy? Can it handle peak loads? These are the questions we're answering.
Essentially, you want to make sure you’re not chasing a fundamentally flawed design before you get too deep.
System-Level Models
Once we decide the battery system is worth pursuing, we start treating it more like an actual piece of technology rather than a theoretical construct. This means building system-level models that simulate how the battery interacts with the grid and other components, using simple equivalent-circuit models.
We introduce a bit of realism—adding voltage variations, resistance, and simplified thermal behavior (i.e., “the battery gets hot if we push it too hard”). Control systems begin to emerge, like setting charge/discharge limits and testing basic management strategies. We also check how the battery behaves under grid events: can it supply frequency regulation or handle sudden load spikes?
At this stage, the model helps refine high-level decisions. Do we need a different battery chemistry? Should we change how we integrate with the power conversion system? These trade-offs get hashed out here.
High-Fidelity Physics-Based Models
Now that we have a viable system concept, it’s time to go deep. We move to physics-based models that simulate the messy realities of electrochemistry, thermal dynamics, and mechanical stresses.
Instead of simple circuits, we start using electrochemical models that capture the movement of lithium ions, polarization effects, and internal degradation over time. We simulate thermal gradients within cells, ensuring that one part of the battery isn’t heating up faster than the rest, which could lead to premature aging (or worse, thermal runaway). Mechanical stress modeling also enters the picture—how do cells swell over time? Will that affect their performance?
At this level, the model becomes a tool for design validation. We use it to confirm cooling strategies, optimize charge profiles, and even predict failure modes before we build a prototype. It’s slow to run, but incredibly insightful.
BMS and Control Models
Once the physical battery design is set, we need to ensure that it operates safely and efficiently. This brings us to Battery Management System (BMS) models, where we simulate software-driven control strategies.
The model now includes state-of-charge estimation (is the battery really at 50%, or is the voltage lying to us?), active balancing (preventing one cell from aging faster than others), and safety interlocks (shutting down if overheating occurs). These models must be fast and accurate, since they eventually get embedded in real hardware.
This is where model-based design shines: instead of tuning BMS parameters experimentally on a real battery (which is slow and risky), we develop and validate control algorithms in simulation first. By the time we put them on a real device, they’re already robust.
Hardware-in-the-Loop (HIL):
Before deployment, we need to make sure the BMS and other control systems behave correctly under real-time conditions. We set up Hardware-in-the-Loop (HIL) testing, where a real BMS controller is connected to a real-time battery model—a virtual battery that mimics real electrical and thermal responses.
This allows us to test edge cases safely. What happens if a sensor fails? How does the BMS react to an unexpected grid event? These failure scenarios are too dangerous to try on actual hardware, but in simulation, they’re invaluable for debugging.
Final Validation and Digital Twins: Preparing for the Real World
Once the battery system is built and deployed, modeling doesn’t stop. We create full-system verification models that incorporate real-world data, allowing operators to predict failures, optimize energy usage, and refine control strategies over time.
Many companies now use digital twins—live models that run in parallel with the physical system, continuously updating based on sensor data. These help forecast maintenance needs, optimize dispatch schedules, and even detect early warning signs of failure before they happen.
Managing Data for Reproducibility and Scale in Model-Based Development
For the sake of brevity, I want to focus on the work that happens at the bottom of the V (i.e. the last phases of development and early phases of validation). It’s also the section of the V-cycle where you’ll really start to suffer if you don't have the right data infrastructure in place.
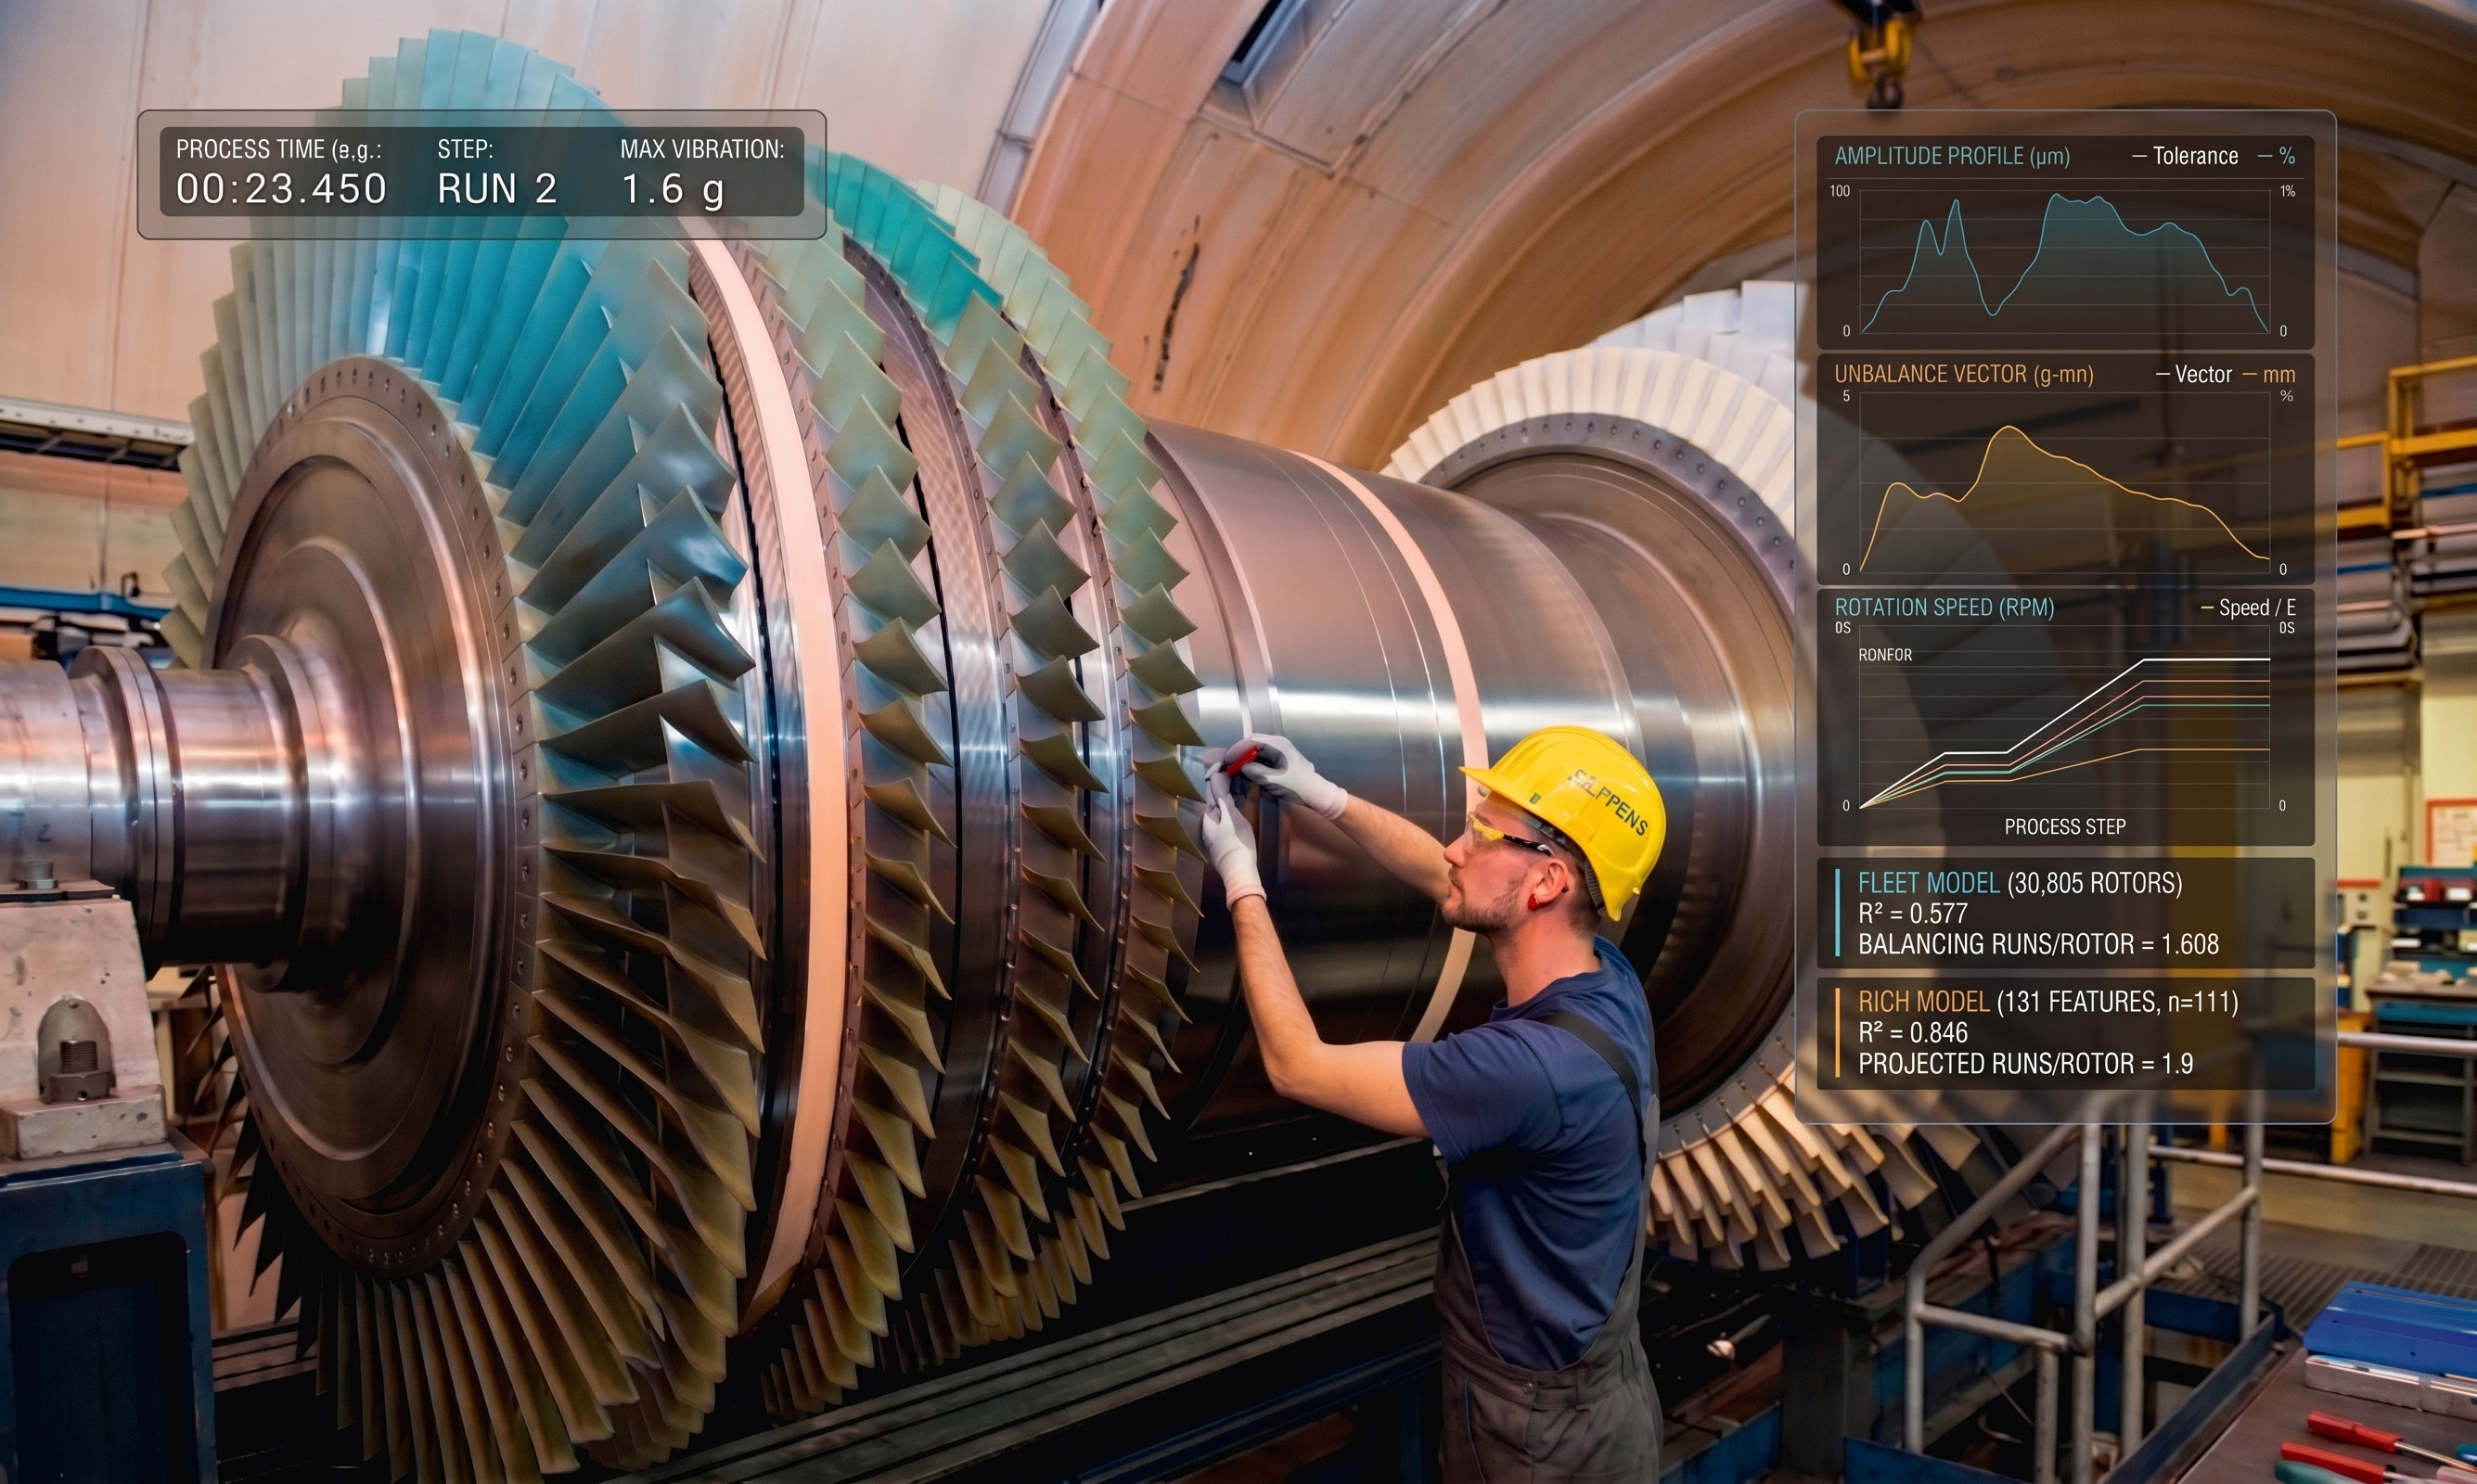
At these stages, any testing process needs to have versioned configuration data, change capture automation, and time-series logging with proper tagging. Let’s break that down.
Managing configuration data
If you’re tweaking constants in your models every test run—adjusting charge rates, thermal thresholds, whatever—you need to track those versions. Every run should be traceable back to its exact configuration. Otherwise, you’re just hoping that your results are reproducible instead of knowing they are.
This means a versioned configuration store—a place where every set of parameters is locked in, immutable, and queryable. You could go with JSONB in PostgreSQL, or something like MongoDB if you want more flexibility. Some teams even use Git-based approaches like DVC when dealing with heavier datasets. The point is, you need a way to say: “Test #42 ran with these precise parameters.”
Linking configurations to time-series data sets
- Battery testing generates sequences, not snapshots. You’re looking at how voltage, current, and temperature evolve over time, which makes a time-series database (TSDB) essential. This isn’t something a relational database excels at—your queries will be slow, and indexing will be painful. Instead, you want something like InfluxDB, TimescaleDB, or even Prometheus if you’re working within a broader monitoring stack.
A good TSDB allows you to ask real questions, like: “How did temperature behave across test runs where we increased discharge rates?” Not just, “What’s the final temperature at the end of the run?” Without this level of logging, you’re blind to patterns that emerge over multiple iterations.
However, you also want to answer questions like “Why was Test #42 different from to Test #43 - what changed?”. The only way to answer questions like this is linking everything with unique identifiers—every single data point should map back to the exact test configuration it came from.
Think of it as a database schema:
- config_versions (immutable)
- test_runs (links to a config_version)
- sensor_data (linked to a test_run)
This makes querying straightforward: “Give me all test runs where temperature exceeded X when using Configuration Y.” No manual cross-referencing, no scraping together logs by hand.
Automation
A system like this should be invisible to engineers using it. No one should have to think about storing versions, tagging data, or manually logging results. That means pipeline automation—tools like Kafka, Airflow, or a structured logging pipeline that automatically dumps results into cloud storage (AWS S3, for example) where they can be indexed later.
At its best, this means:
- An engineer submits a new configuration via a UI.
- The system assigns a unique version ID.
- Tests execute and data streams into the TSDB, linked to the correct configuration.
- A dashboard lets engineers see trends, compare runs, and identify anomalies.
With this setup, no one has to manually correlate test logs. No one has to re-run tests just to figure out what changed. Everything just works.
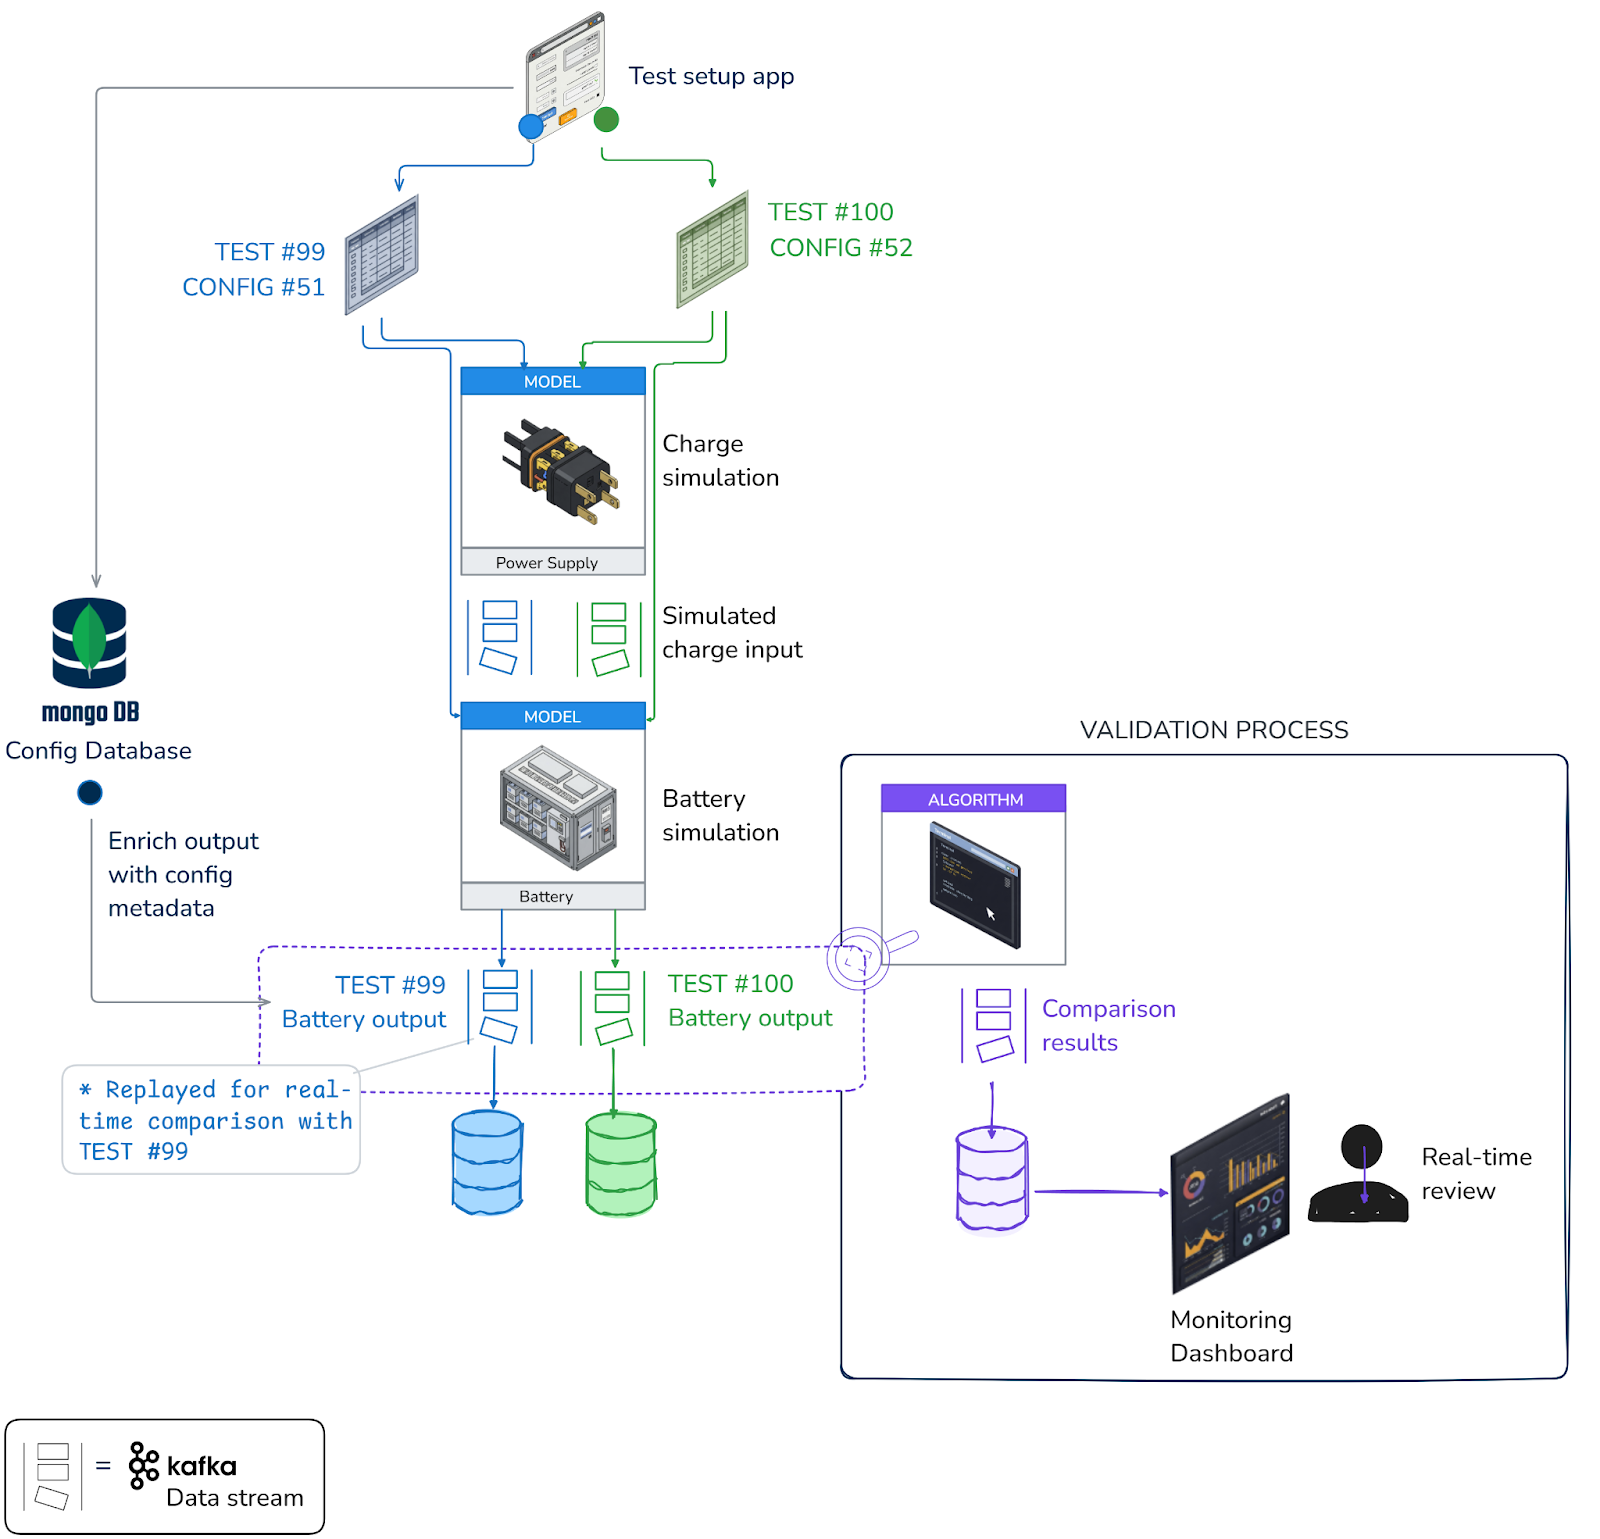
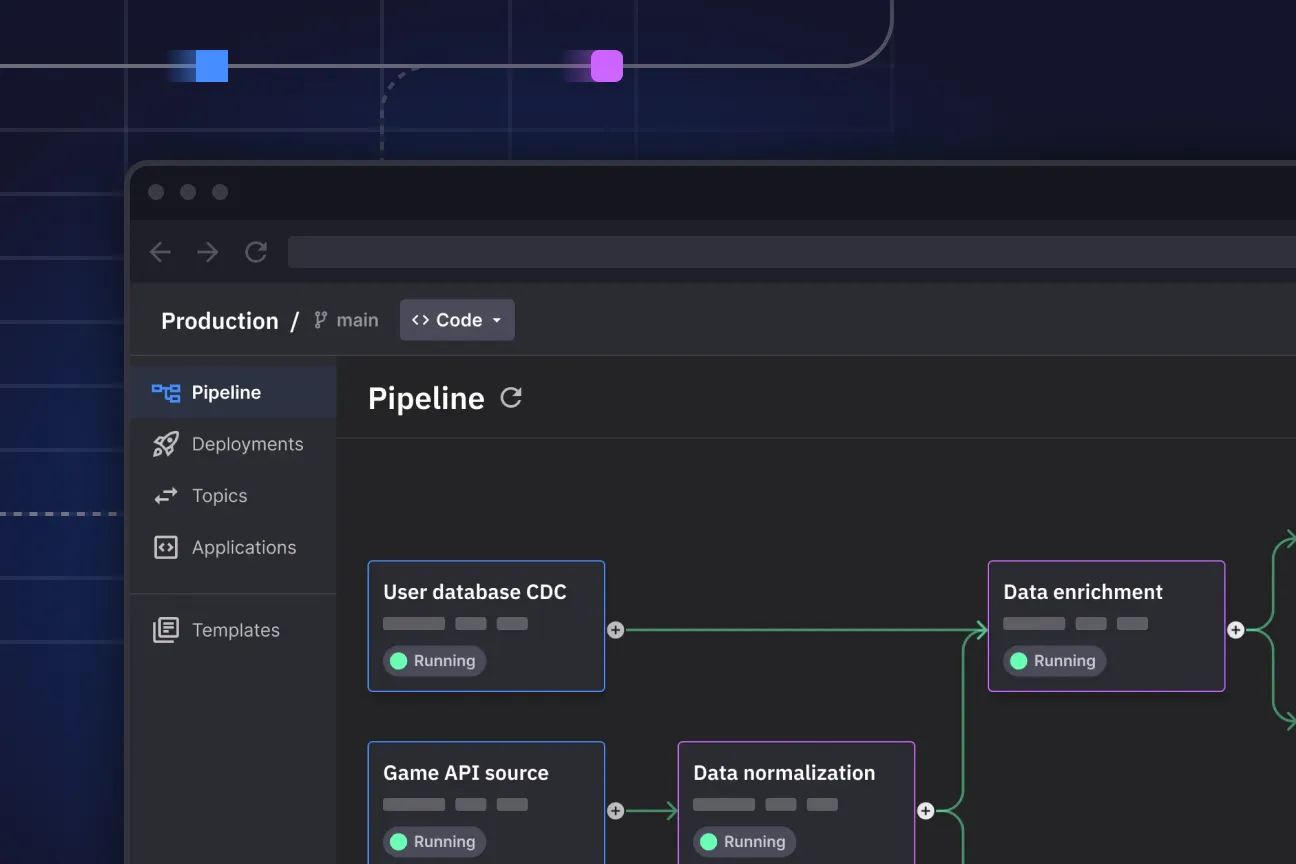
A sample architecture for managing configurations
Let’s assume you have some kind of test software with a user interface configuring the test conditions and model parameters. This is the starting point for capturing configuration changes.

As you can see in the following diagram, the testing software is responsible for transmitting configuration changes to some kind of change tracking database.

Here’s the basic workflow:
- Whenever an engineer configures a new test (e.g. to test a BMS module) the test system would broadcast a change event via some kind of API (your software hopefully comes with its own event tracking API otherwise you might need to do a bit of integration work).
- These changes are instantly propagated to a database (in this example MongoDB) via a message queue and stored with identifiers for the config and test run.
- Once the test starts running, the stream processing application can automatically correlate the test results with the original configuration using a database lookup on the test ID.
- This metadata can be encoded into the message key (using a re-keying process). Later, the time-series data can be written in a time-series database such as InfluxDB, where the metadata is stored as tags.
At first glance, this might seem like a duplication of data, but the advantage is that downstream systems don't have to depend on querying the original system that the engineers used to configure the test. They have their own copy of the original configuration so all relevant test data is kept within one system
Processing model outputs efficiently
When iterating on model-based tests, it's very time consuming to compare the results after it has hit the database. Ideally you want to process the data as it comes in. If you’re doing Model In the loop testing (MIL), it is essential to process the outputs in real-time.
For example, when testing a Battery Management System (BMS), simulations typically follow one of two approaches: open-loop or closed-loop. Both techniques involve processing streams of time-series data but the goals are different.
In open-loop testing, the system processes predefined inputs, and engineers analyze the results afterward—useful for validating models against known conditions. Closed-loop testing, on the other hand, feeds the output back into the system, allowing it to adjust dynamically, much like it would in a real-world deployment (i.e. Model in the Loop testing).
Both methods are essential, but they come with challenges in handling and comparing test data—challenges that streaming platforms (such as Apache Kafka) can simplify dramatically.
Open Loop Testing
In a typical open-loop test, you’re running a simulated BMS against a predefined set of conditions, capturing the output, and then analyzing it later. However, the speed at which you can iterate depends on the tools you use to capture the data.
Time-series databases have their limitations
If you’re using a time-series database, you’re stuck with a batch-oriented workflow: run the test, store the data, query it, then manually compare results across different runs. That’s fine if you only do it occasionally, but when you need to iterate quickly—tweaking control parameters, adjusting assumptions, or stress-testing edge cases—the friction adds up fast. Every comparison becomes a slow, manual exercise in data retrieval and alignment.
Streaming platforms allow you to iterate faster
With a streaming platform, test data flows continuously, making it trivial to compare multiple runs as they happen. You can stream test results into real-time dashboards, apply transformations on the fly, and even run multiple BMS models in parallel, feeding them the same input data to see how they differ. Want to compare today’s test against a baseline from last week? Just replay the old run into the same pipeline—no need to dig through a database and reconstruct past conditions manually.
An example test architecture that incorporates data streaming
The following diagram illustrates how a Kafka-compatible stream processing application (Quix Streams, Kafka Streams, Flink, etc.) can compare two different test results in real-time and provide a report as soon as the test is done.
Closed Loop Testing
Open-loop testing is great for validating how a BMS responds to predefined conditions, but it doesn’t tell you how the system learns and adapts. Closed loop testing introduces control logic into the equation.
A proper BMS needs to react—adjusting charge rates, shifting loads, and making split-second decisions to keep everything stable. Instead of just logging results for later analysis, the system feeds its own outputs back in, adapting its behavior as conditions change. This is how you find out whether a BMS can actually manage a battery.
A streaming platform like Kafka makes this process possible by handling test data as a live event stream. The BMS can react immediately, adjusting parameters mid-run, stress-testing its own decisions, and even running competing control models in parallel. Engineers don’t have to wait for results—they can watch the system evolve in real time, fine-tuning the logic as it plays out.
For example, we’ve updated our diagram to show the data processing algorithm has changed to a control based mechanism that sends signals to the control module to recalibrate its settings.

The transition to full digital twin
A closed-loop test setup isn’t just useful for refining a BMS—it’s the foundation for something much bigger. The key difference between testing and a digital twin is scope. In testing, the BMS is treated as an isolated system, running through predefined scenarios to see how it reacts.
A digital twin, on the other hand, models the entire energy storage system—batteries, inverters, grid interactions, and environmental factors—continuously updating itself with live data to reflect real-world conditions.
The architecture doesn’t change, it just expands.

The same Kafka-based pipeline that streamed test data now ingests real telemetry from devices in the field. Instead of validating control logic, the models shift to optimizing system-wide performance—predicting failures, adjusting energy dispatch, and simulating edge cases before they happen.
A digital twin isn’t just about mirroring the system; it’s about giving operators a way to test decisions before they make them.
This transition works because closed-loop testing already established the right foundation: real-time data ingestion, replayable event streams, and model-driven feedback. Scaling up doesn’t mean rethinking the architecture, just extending it. What started as a test environment for a BMS becomes a real-time intelligence layer for the entire energy network.
Incorporating hybrid models
Hybrid modeling is a very popular and effective approach in MBD, but again, you need a robust data infrastructure to do it properly. The idea is to train ML models on real-world test data to capture patterns that are too complex, nonlinear, or computationally expensive for physics models to simulate directly.

(Source: ResearchGate)
To do this, you need clean, well-structured, and perfectly correlated data.
That’s why the whole time-series database and metadata tracking infrastructure isn’t just for human convenience—it’s a prerequisite for training any useful ML models.
Let’s say you’re trying to train an ML model to predict early signs of battery degradation. You need:
- Time-series data of every charge/discharge cycle.
- Environmental conditions (temperature, humidity, etc.).
- Sensor readings correlated precisely to test configurations.
- A history of anomalies and maintenance records that a physics model wouldn’t catch.
Without meticulously versioned, timestamped, and linked data, you risk training models on inconsistent, mislabeled datasets—which can waste a lot of time later on.
In a well-architected system, every ML training set pulls from structured, versioned test data. This allows you to slice the dataset by specific conditions—e.g., train an ML model only on tests where a battery was operated in high heat.
Even if you’re not necessarily ready to start hybrid modeling yet, getting the data infrastructure right from the start makes the transition very easy.
Data is the foundation of model-based development
Model-Based Development isn’t just about designing the model, it’s about making sure the right data flows through every stage, from initial concept to full-scale production. Whether you're testing a BMS in isolation, scaling up to closed-loop control, or deploying a full digital twin, success depends on how well you manage configuration changes and test results (time-series data).
This is where most teams run into trouble. Relying on time-series databases alone can get you some of the way, they’re not the ideal tool for replaying and analyzing test runs as they happened—which is the key to faster iteration.
Your testing process will be more efficient if you supplement your time-series database with a streaming platform. For example, a tool like InfluxDB can provide a high-performance time-series database for storing and querying historical test results, giving engineers the ability to analyze long-term trends, compare past performance, and train predictive models. Quix, on the other hand, enables real-time stream processing, allowing data to be processed in motion rather than waiting for storage.
By integrating these two technologies, you can move beyond basic simulation and validation and experiment with more advanced data processing techniques.
Essentially, if you don’t get your data infrastructure right, you’ll never realize the full potential of model based development. With tools like Quix and InfluxDB, you’re no longer just running tests—you’re building a foundation for continuous optimization, from prototype to production.
Last updated:
Mar 13, 2025

Check out the repo
Our Python client library is open source, and brings DataFrames and the Python ecosystem to stream processing.
Interested in Quix Cloud?
Take a look around and explore the features of our platform.
Interested in Quix Cloud?
Take a look around and explore the features of our platform.