Introducing Streaming DataFrames
Learn how Streaming DataFrames can simplify real-time data processing in Python with a familiar DataFrame approach.

Pandas makes it easy to manipulate static tabular data in Python, so why can’t we have that for streaming data too? We’ve built Quix Streams to provide just that. Quix Streams is a stateful stream processing library written purely in Python. In its most recent evolution (v2.4) it now features a Streaming DataFrame API, which makes it easier for data professionals to process data in motion.
What exactly is a Streaming DataFrame? Streaming data is almost always converted at some point into tabular data (often with a time series index). You can think of Streaming DataFrames as a Kafka topic projected onto an infinite table:

In a standard batch process, you load the data, and then each operation manipulates the entire dataset once, producing the result. In stream processing, data is often unbounded (endless) so we have to change the way things are calculated. The system must process each message immediately while simultaneously maintaining the operation's state. This approach adds considerable complexity, which Quix Streams seamlessly manages.
So how does it work in practice? Let's take a look.
Imagine you have sensor data that resembles the following example:
{
  "altitude": 66.00699234008789,
  "latitude": 51.51702398660161,
  "longitude": -0.07786049082146952,
  "speed_m_s": 21,
  "timestamp": 1708516467516460000
}
If you stored data like this in a static JSON file, you’d just load it into a DataFrame using Pandas like this.
df = pd.read_json('sensor_data.json')
In a streaming environment, these records would be coming through continuously as messages that are streamed via a topic in a Kafka API-compatible broker (such as Redpanda). In Quix Streams, you can also use a one-liner to perform the equivalent operation:
sdf = app.dataframe(app.topic("sensor-data"))
This adds rows to a Streaming DataFrame in the required format, allowing you to process them as they arrive. Ok, so now what? What if we want to convert the speed measurement units from meters per second to kilometers per hour?
With static data in Pandas, you’d do this:
df["speed_km_h"] = df["speed_m_s"] * 3.6
In Quix Streams, it’s pretty much the same thing…
sdf["speed_km_h"] = sdf["speed_m_s"] * 3.6
…except it’s being done continuously and the updated records can be sent to the output topic with almost no delay after they have been processed.
Let’s try something more complicated.
What if we only want GPS coordinates from rows where the speed is greater than 100 km/h? This will allow us to filter only for vehicles on motorways.
Here’s how you do it in Pandas.
df = df[["latitude", "longitude", "timestamp"]]
df = df[df["speed_km_h"] > 100.0]
And here’s how you do it in Quix Streams.
sdf = sdf[["latitude", "longitude", "timestamp"]]
sdf = sdf[sdf["speed_km_h"] > 100.0]
Again, pretty much the same right?
However, we need to discuss one big difference between using Pandas to process static data (batch processing) and Quix Streams to process data in motion (stream processing): Statefulness.
How Quix does stateful stream processing
Stateful stream processing is like doing long divisions on paper, versus solving a list of very basic addition equations like “1+1 = 2”.
You don't need to write any notes to solve the simple equations, you can do them in your head and they don't depend on the results of previous equations. With long division, you need a pen and paper to store your intermediate steps before you arrive at the result. The paper acts as your “state”. Complex, cumulative, continuous calculations (try saying that in a hurry) need the same kind of state.
Here’s a practical example:
Continuing with the speed measurement, what if we want to measure an average speed of 30-second chunks? In this case, you’ll want to use a tumbling window. Of course, windowed calculations also exist in Pandas. Here’s an example of how you’d use a window operation on static data.
df["speed_km_h"].resample('30s').mean()
But, since Pandas has all the data up front, this is a stateless operation. Pandas doesn’t need to keep track of anything.
Here’s how you’d do the same operation on a Streaming DataFrame using Quix Streams.
sdf = sdf.apply(lambda row: row["speed_km_h"]) \
	.tumbling_window(timedelta(seconds=3O), grace_ms=timedelta(seconds=1) \
	.mean() \
	.final()
The difference here is that Quix Streams automatically keeps track of the current state of the calculation. In order to calculate an average it needs to store the state of the readings for the last 30 seconds, and generate an average when that 30-second window has closed. We add a one second grace period to account for unordered delayed records.
Quix Streams keeps the state accessible, even if a process restarts due to system failures or service updates. You can store the state in managed storage, allowing distributed processes to share and reassign tasks seamlessly. On top of that, Quix Streams uses changelog topics in Kafka to protect the state, ensuring that your system quickly recovers from challenges such as database corruption or migration to a different Kubernetes cluster. You get all the power and guarantees of Kafka but in a lightweight client library.
Aren’t you supposed to use Flink or Spark Structured Streaming for stream processing?
Certainly, you can, they are indeed very powerful tools. However they are mostly Java-based or Scala-based tools for people with JVM-language skills.
Python on the other hand is great for people who aren’t necessarily professional software engineers but work in different domains. For example, scientists, mechanical engineers, or academics often use Python to solve specific problems, but programming is not their main job. It’s the same in the data industry.
Data scientists use Python to create algorithms and machine learning models but they’re not well-versed in software engineering principles. Algorithms and machine learning models are often used in stream processing pipelines, so their work often gets ported into Java by software engineers, which can create a lot of friction and hassle along the way.
You can still use Python with Flink and Spark, can’t you?
You can. But it’s not exactly a cakewalk because PyFlink and PySpark are APIs that wrap the underlying JVM language. This interplay between the Python interpreter and the JVM makes things more complicated.
For example, see this architecture diagram that illustrates how PyFlink integrates with Flink:

There are a lot of layers and integration points here.
And if you’re doing anything remotely complex (like integrating an ML model) you’ll need to create a UDF (User Defined Function). This is not a fun job for people who like building ML models. Incorporating an ML model through a UDF not only complicates the process but also shifts much of the operational burden to software engineers, who must navigate intricate infrastructure and interoperability issues. This makes ML teams much more dependent on others to put their code into production. Issues are also harder to debug since engineers must sift through Java exceptions with extensive stack traces that obscure the root causes in the Python code. Thus, if you’re going to use Flink, it’s a lot easier to write your code directly in Java. But again, that’s not everyone's cup of coffee.
Here’s how you would integrate an ML model using Quix Streams:
Imagine a situation where you want to predict the type of transport being used (car, bicycle, walking, etc) based on raw GPS data. You have a model that can infer the transport method based on patterns in 10 seconds of GPS data.
You’ll want to use a window operation to continuously supply the model with the context of the last 10 seconds of data.
The first step would be to load a pre-trained and pickled ML artifact from a model registry.
First, we pip install the required Python packages (because we have the power of the entire Python ecosystem at our fingertips):
pip install azure-storage-blob xgboost==0.90 scikit-learn
Then we load the artifact (ML model).
def load_ml_model():
	model = "mode_of_transport_v1.pkl"
	blob = BlobClient.from_connection_string(
		"<CONNECTION_STRING>",
		"models",
		model,
	)

	with open(model, "wb+") as my_blob:
		print("Loading the model...")
		blob_data = blob.download_blob()
		blob_data.readinto(my_blob)
		print("Loaded")

	loaded_model = pickle.load(open(model, "rb"))
	return loaded_model
Finally, we use it in our window operation:
# Load the model into memory.
ml_model = load_ml_model()
# Aggregate all rows into 10-second windows.
sdf = sdf.tumbling_window(timedelta(seconds=1O)) \\
	.reduce(lambda state, row: state + [row], lambda row: [row]) \\
	.final()

# Call the model with the last 10s worth of data
def predict_and_expand(window: dict):
	result = []
	vehicle_type = ml_model.predict(window["value"])

	for row in window["value"]:
		# Set the inferred mode of transport to the vehicle_type column.
		result.append({
			"vehicle_type": vehicle_type,
			**row
		})

	return result

sdf = sdf.apply(predict_and_expand, expand=True)
Note: The expand parameter returns an iterable where each entry gets processed separately. In this case it’s used to expand items in the windowed calculation back into individual rows along with the result of the inference from the ML model.
This will produce a message that resembles the following example (with “vehicle type” being the output from the ML model):
{
  "altitude": 66.00699234008789,
  "latitude": 51.51702398660161,
  "longitude": -0.07786049082146952,
  "speed_m_s": 7,
  "timestamp": 1708516467516460000,
  "vehicle_type": "bicycle"
}
That's it. You use Python to load the model, run a windowed calculation, and get an inference from the model. Thus, you don’t need to register a UDF anywhere to handle the ML-specific components.
It’s surprisingly easy to build a real-time data pipeline in Python to achieve whatever you need to do. You can calculate values using simple math or call an ML model to do the heavy lifting.
This all sounds good, but how does it scale?
When it comes to stream processing, performance is the deciding factor. Indeed, that’s why many software engineers shun Python in general, as it’s believed to be less performant than Java or C++. While this is undoubtedly true, the issue becomes less important when you implement distributed parallel processing. You can redesign how data is partitioned and scale horizontally to accommodate for any performance shortfall.
It's no mean feat to scale stream processing horizontally
Scaling horizontally gets tricky because it means dealing with complex tools like Kubernetes or AWS ECS. You could dockerize your stream processing applications and deploy them on these kinds of platforms, but many large organizations still go for specialized server-side solutions such as Flink and Spark Structured Streaming to scale their stream processing pipelines. These solutions integrate with Apache Kafka and have been proven to scale effectively through years of maturity.
Although software engineers can pick up Flink or Spark fairly quickly, these engineers are highly in demand. Many data or ML professionals cannot go from prototype to staging without a software engineer’s help. If we want more people to participate in building and managing streaming pipelines, we need simpler tools that are tailor-made for stream processing pipelines.
For example, look at the progress made to make Kafka (or stream transport in general) more accessible. Many teams no longer have to deal with the low-level aspects of maintaining a Kafka cluster. We now have managed tools like Confluent Cloud and Redpanda Cloud that abstract away much of the complexity and give us more autonomy. It's time that we had something similar for stream processing.
Stream processing applications need specialized horizontal scaling solutions
This is the thinking behind Quix Cloud: providing managed serverless containers that are tailor-made to run Quix Streams applications. Developers and data teams don't have to jump through hoops just to authenticate their stream processing applications and give them the right permissions.
You define your broker address just once at the project level and that's it. All the services in the project can automatically connect to it. Quix Cloud also centralizes state management and integrates tightly with managed Kafka providers so it’s very easy to scale every part of the pipeline.
Summary
Quix Streams and its new Streaming DataFrame API make it easy to process streaming data using pure Python. Our goal is to manage the painful parts of stream processing. Instead of getting bogged down with managing state across replicas or wrangling windowed calculations, you can focus on your high-level business logic and get things done faster.
You don't need to be a Java expert or even a pro in Python for that matter, the Quix Streams Python library allows Python novices and experts alike to build stream processing applications as well as streaming ETL pipelines. This means you can leverage the untapped Python skills you might already have in your team to quickly iterate on new ideas such as aggregating data on the fly before you write it to a data warehouse (saving you storage costs) or sending a Slack alert when you detect certain patterns in real-time data feeds.
If you want to know more about anything that I’ve touched on in this article or anything related to stream processing in general, then drop me a line in the Quix Slack community. And if you disagree with any of the points I’ve raised, feel free to chime in too. I’m passionate about helping people realize their project ideas with our library and l love getting feedback so that I can use it to improve the library. Let's bring the power of stream processing to the Python community!

Check out the repo
Our Python client library is open source, and brings DataFrames and the Python ecosystem to stream processing.

Interested in Quix Cloud?
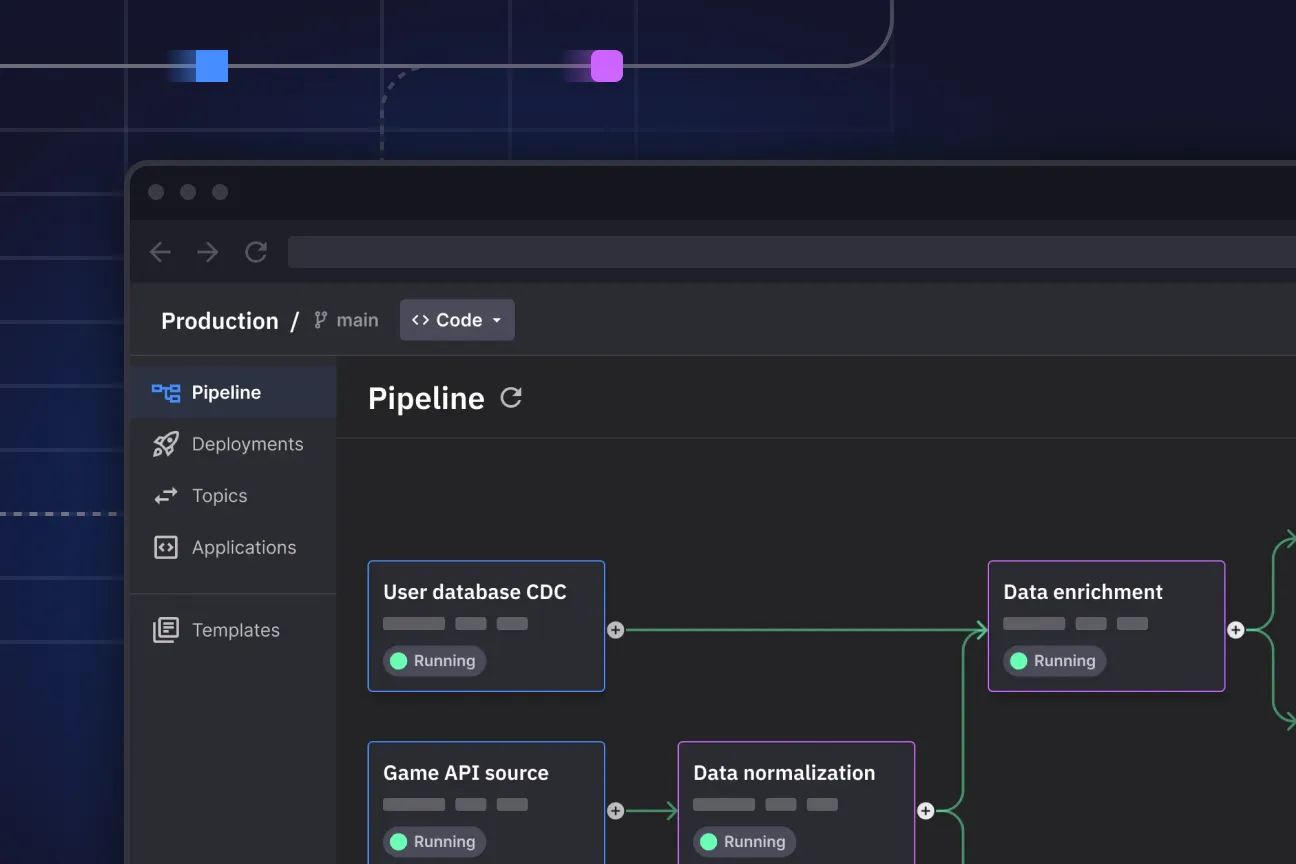
Take a look around and explore the features of our platform.

Interested in Quix Cloud?
Take a look around and explore the features of our platform.

.svg)


