.svg)
Releases
Oct 17, 2025
How to take control of your test rig data: a hands-on walkthrough with Quix
See how Quix transforms fragmented test rig data into real-time insights. Walkthrough of our drone demo showing traceability and faster R&D cycles

One of the hardest things about industrial R&D is getting proper insights from your test data. There is a lot of data archeology involved before you can go from DAQ to Dashboard and get the right visualizations. The fundamental point of scientific and industrial research is to compare experiments and see what produced the most optimal results. You can’t do that without reliable data.
In my previous article, "Solving model-based design challenges in industrial R&D” I outlined these core data management challenges. Since then, we’ve designed a physical demonstration to prove the points that I was trying to make.
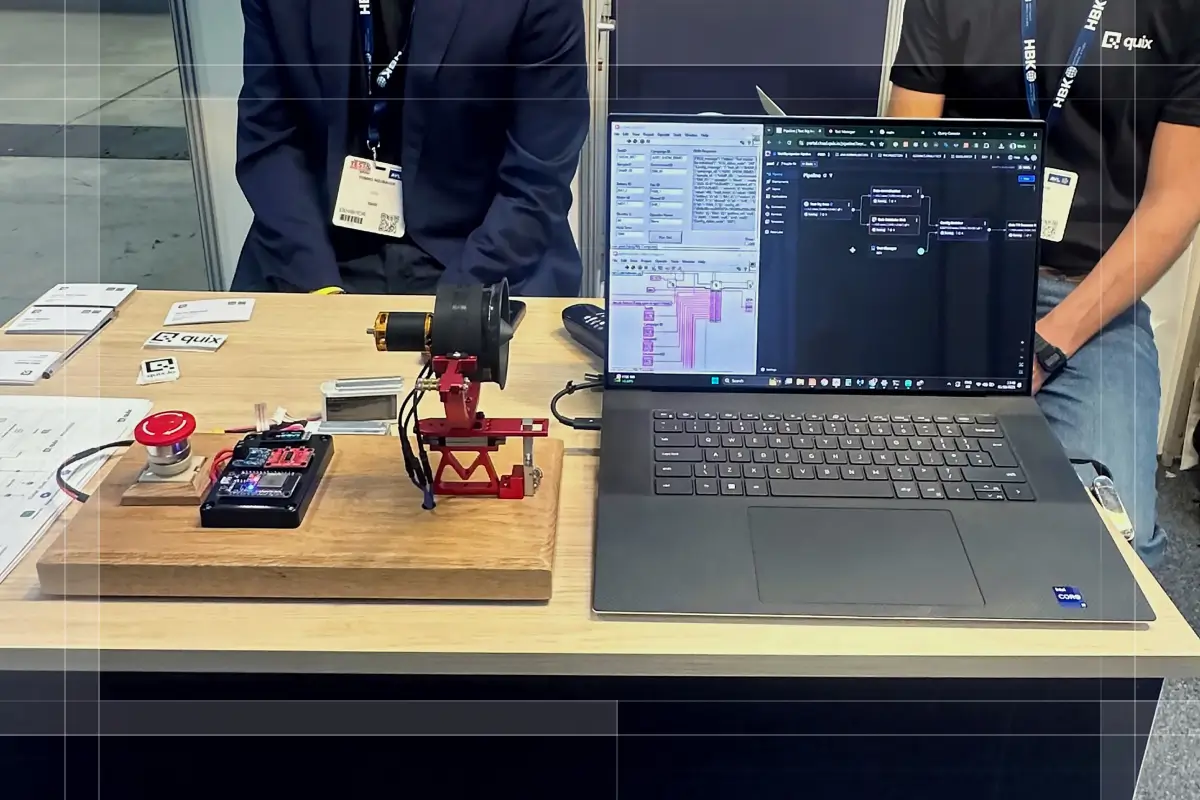
We debuted it at the Quix booth during the Aerospace Test & Development Show 2025 in Toulouse. It’s a drone-inspired propulsion test rig, complete with an electric ducted fan, a load cell to measure thrust, and a suite of sensors streaming live data into Quix.

If you prefer video, I posted a brief clip of it in action on LinkedIn.
Here, I want to walk you through the demo and use it as an example of how Quix can help your teams dramatically speed up your R&D cycles by removing most of the time-consuming busy work that normally comes with managing test data,
So what exactly is going on here? It’s a test rig designed to assess the performance we can get out of different battery configurations under a high-power load.
It’s a toy example, but it is inspired by a real-world testing scenario.
For arguments sake, let's say we’re developing some kind of autonomous delivery drone and our goal is to increase the drone's payload capacity. We need to reduce the drone's overall weight, and we’ve identified some lighter batteries but we need to test which one has best performance.
"Can the new, lightweight 'Battery B' deliver the high current required for our target thrust without experiencing a critical voltage drop? And how does that voltage stability (or lack thereof) affect the motor's ability to maintain consistent thrust during a high-power maneuver?"
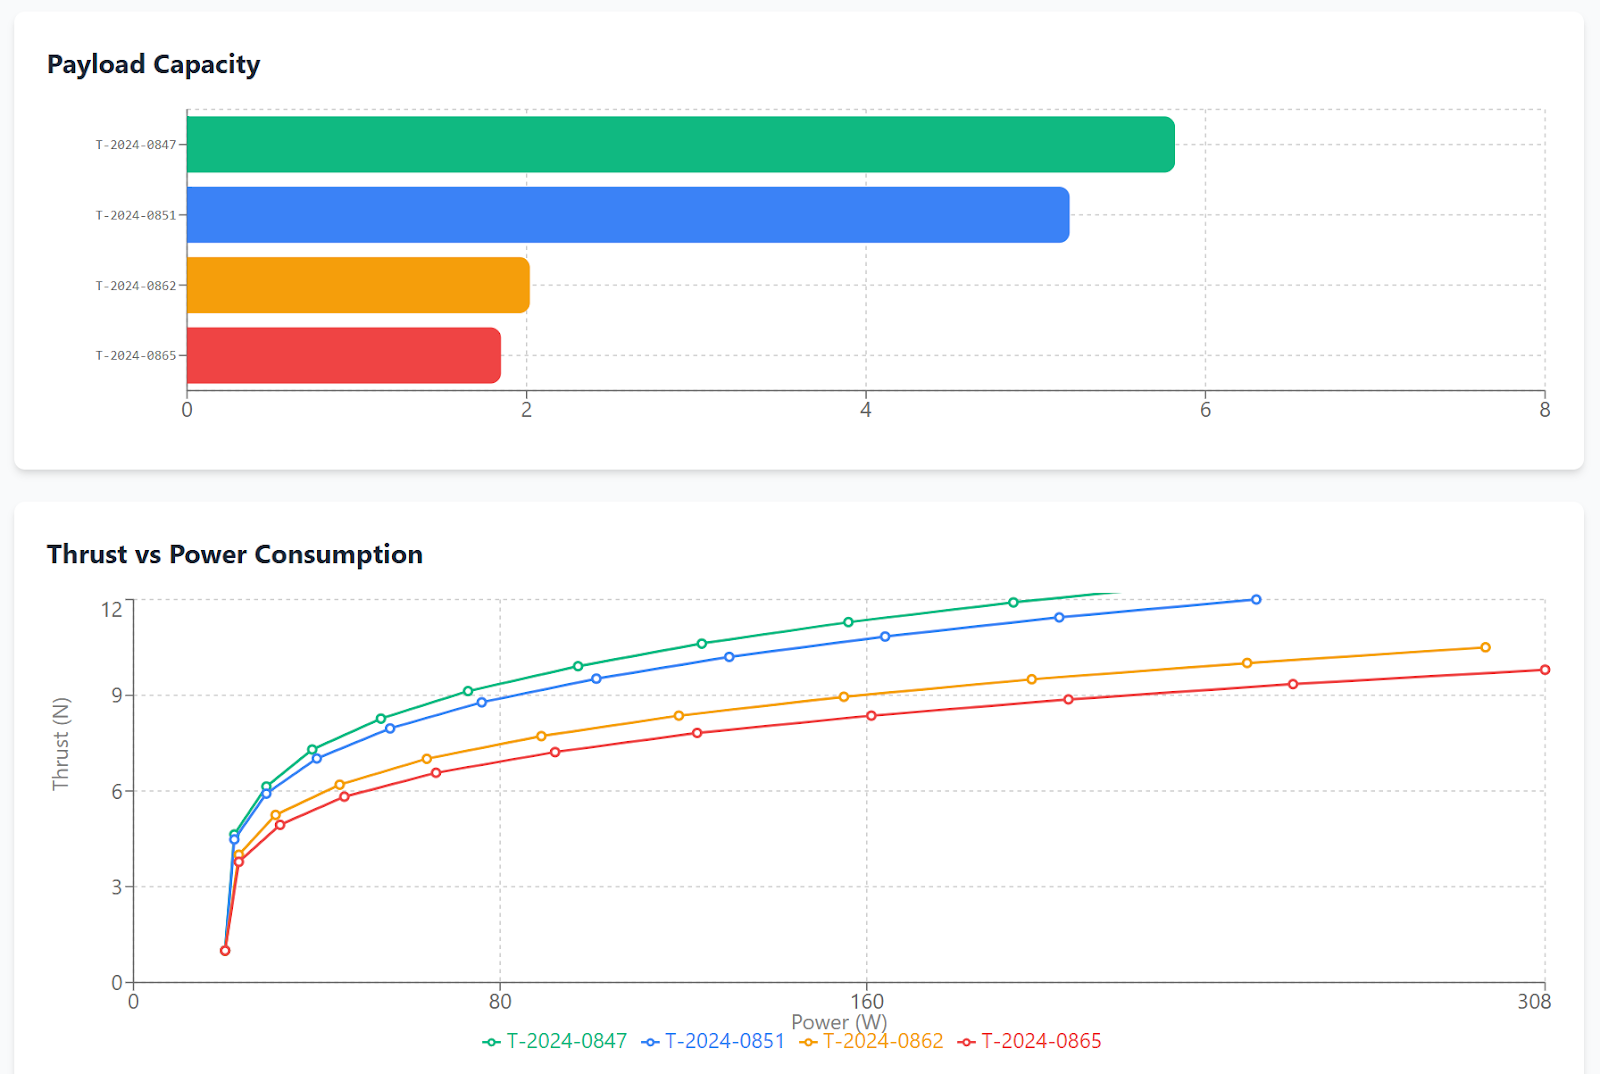
We want to end up with a Dashboard like this, which allows us to compare the test data and present our findings in a visually compelling way.
A dashboard like this looks straightforward, but getting here can be painful. It involves a long journey of manual data wrangling before the data is ready to visualize. Let’s look at where most of these downstream issues start, and how they're solved in our demo.
Step 1: Configuring and Setting the Test
In this step, test engineers usually configure a wide range of metadata and test settings (test campaign details, sensor channel mappings, measurement points and so on). The problem here, is that all of this setup data tends to get divorced from the raw measurement data being collected from the test rig.
That’s why it’s extremely important to store this configuration data in a centralized place, because you’ll need the ability to tie it back to your test data further down the line.
Here’s how it works with with our demo test rig:
Configuring and running our test demo in LabVIEW
OK, our engineer is at our physical test rig. For the first baseline test, they connect the trusted "Battery A." In their LabVIEW HMI, they enter parameters that resemble the following example:
- Campaign ID: Battery_Eval_Oct25
- Test ID: TEST_001_Baseline_BattA
- Asset Configuration: motor: standard_v2, battery: premium_supplier_A
- Test Parameters: throttle: 75%, duration_seconds: 60
When they click "Start Test," LabVIEW sends a command to the motor and simultaneously sends all this metadata as a structured JSON file to the Quix platform's API.
Centralizing configuration changes in a central data platform
This is where Quix immediately departs from the file based model. The metadata isn't just saved to a local file; it's sent to two key back-end components that work in tandem.
Here’s an illustration of the relevant architecture involved at this point.
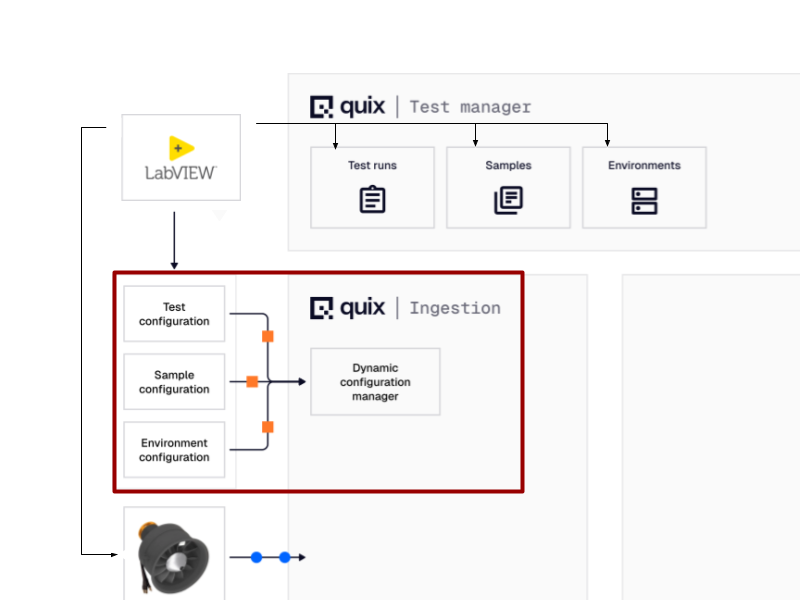
- The Dynamic Configuration Manager (DCM): This is the system's "registrar." The LabVIEW application makes an API call, sending the metadata as a structured JSON file. The DCM receives this payload, versions it, and stores it. Crucially, it then publishes a lightweight notification message to an internal Config Update Topic. This message doesn't contain the full configuration, just its ID and a URL to retrieve it from the configuration database.
- The Test Manager: This is the central source of truth for all test runs. It's a web-based UI that listens for new tests and allows you to browse historical test data. As soon as the DCM registers the configuration for TEST_001_Baseline, the test appears in the Test Manager's dashboard with a status of "In Progress.”.
In one single action, the test is not only started, but its entire context is versioned, stored, and cataloged in a central, accessible location. The problem of fragmented setup data is solved from the very first click.
TIP: If you want to learn how to send data from LabView to Quix in the same manner (using our APIs), check out our tutorial video “LabVIEW to Quix with Python” and the accompanying repo in GitHub.
Step 2: Processing the Test Data
With the test running, we capture and process the time-series data in real-time. The test rig is instrumented with sensors measuring thrust (from a load cell), current draw, battery voltage, and vibration.
Our demo setup resembles a more "IoT-style" architecture, because the microcontroller immediately samples the analog signals at 100Hz and posts this raw data stream to the Quix API along with the current Test ID (TEST_001_Baseline_BattA).
The physical device doesn't need to know all the rich details of the test configuration (like the motor type, the campaign name, or the calibration factors). It only needs to know the one piece of context that matters at the source: the Test ID. This ID acts as the crucial lookup key for everything that happens next in the cloud
Here’s our architecture diagram again with normalization components added:
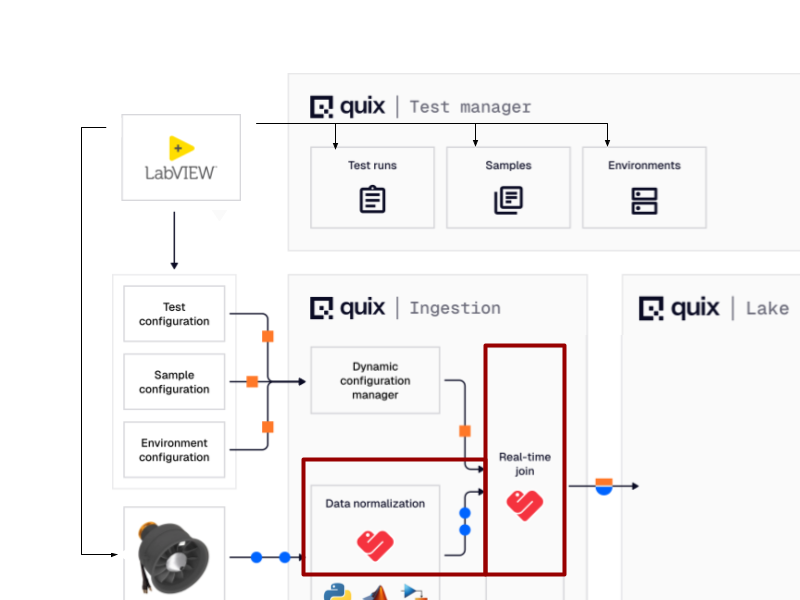
Data processing and normalization happens in real-time
After the data enters the Quix platform, the “data normalization” service performs the first cleanup step: it un-batches the incoming data, flattens the schema, and corrects the timestamps from relative offsets to absolute time.
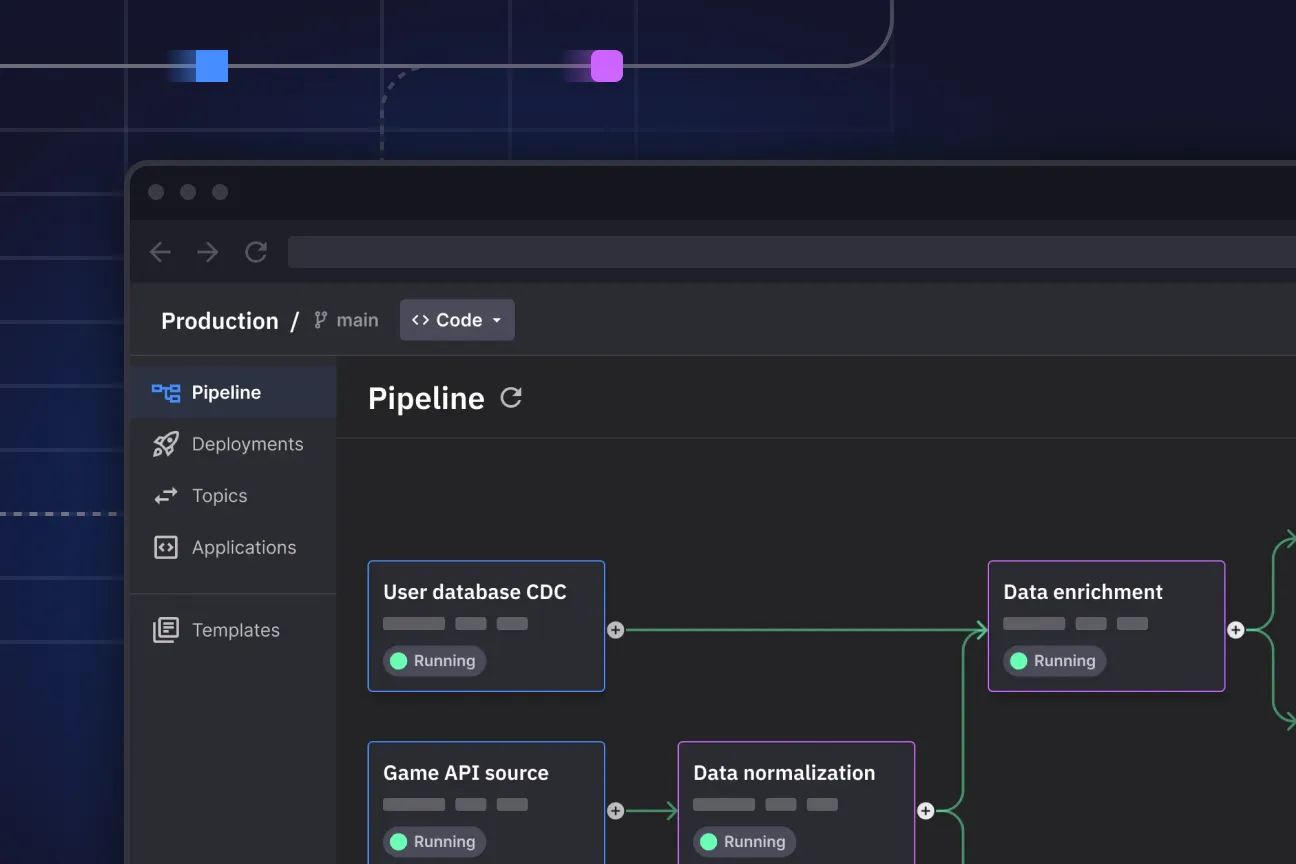
To make this clearer, here’s a screenshot of the pipeline from the Quix platform itself.

By the way, all of the “nodes” in the screenshot are small Python programs that you can customize to your requirements. You can find the code that powers these nodes in the accompanying GitHub repo.
Note that we’ve intentionally kept this data processing pipeline example very simple. In reality, many of our customers run MATLAB nodes to perform real-time models or multiple downsampling nodes so that they can store and query the data at different resolutions.
Test data is immediately enriched with its testing context
No matter how we process the data, we need to tie the result back to the full test configuration. This is where that Test ID becomes critical. In our demo scenario, the normalized sensor data stream is immediately passed to the “Config Enricher” service.
This service uses the Test ID from the incoming data as a key to perform a fast lookup against the configurations cached from the Dynamic Configuration Manager. It finds the full configuration for TEST_001_Baseline_BattA and merges the rich contextual details into the data stream.
This automatically transforms the data, making it far easier to interpret:
- Data from the rig:
test_id: "TEST_001_...", timestamp: 123456.78, raw_thrust_value: 4095 - After enrichment in Quix:
test_id: "TEST_001_...", timestamp: 123456.78, raw_thrust_value: 4095, battery: "premium_supplier_A", motor: "standard_v2"
This saves a tremendous amount of time. In a typical R&D workflow, this enrichment is a manual, after-the-fact process. An engineer would have to finish the test, export a giant log file, and then later hunt down the original configuration files to correlate assets and settings to the test outcomes—a real drain on valuable engineering time. With this real-time join, the data is born ready for analysis.
Step 3: Analyzing the Test data
Now that the data has been captured and normalized we can start analyzing and comparing the test results. Although the data is collected in real time and can also be visualized in real time, most in-depth analysis happens after the test is finished.
In our demo, we write the enrichment data to a Lakehouse that is built into the Quix platform. This Lakehouse storage paradigm allows us to store and analyze vast amounts of data without having to sacrifice on query performance.
Here is where the Lakehouse fits into the Quix platform architecture:
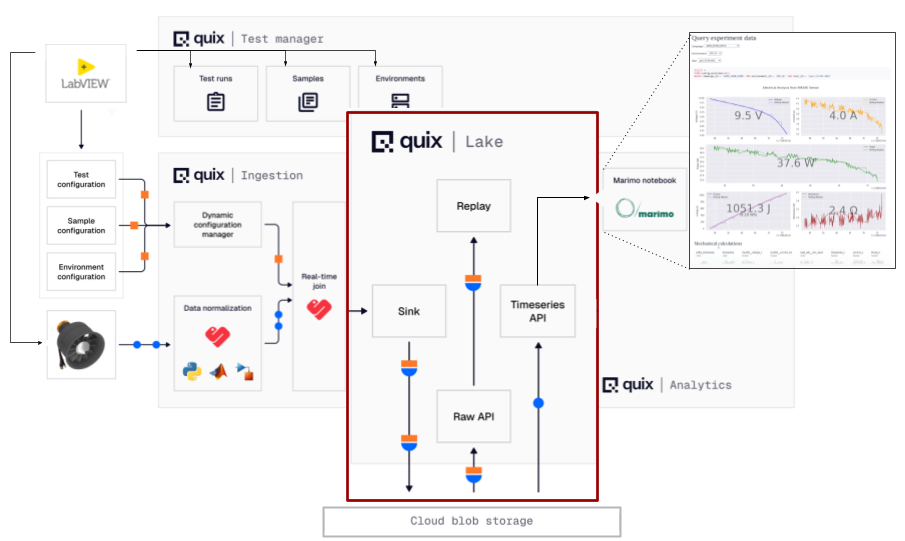
Centralizing data in a Lakehouse
A Data Lakehouse lets you store massive volumes of raw data (structured, semi-structured, unstructured) on cheap object storage (like Amazon’s S3 cloud storage or MinIO’s on-premise storage) but gives you the features that you’d expect in a data warehouse (indexing, metadata, versioning, and so on).
This means that you don’t have to keep repackaging the data for different use cases or import it into different systems for different users. No more fragmented test files stored on different network drives. As long as you have the right metadata, you can centralize it all in the Quix Lakehouse while still being able to query it easily.
Querying and Visualizing the Data
For example, in our demo, we connected a Marimo Notebook (a kind of Jupyter Notebook that behaves like a web app) to the Quix Data Lakehouse, so that engineers could easily visualize and compare data from different test runs.
Here’s an example of a notebook that lets you select a test run and then compare the metrics to another test run.
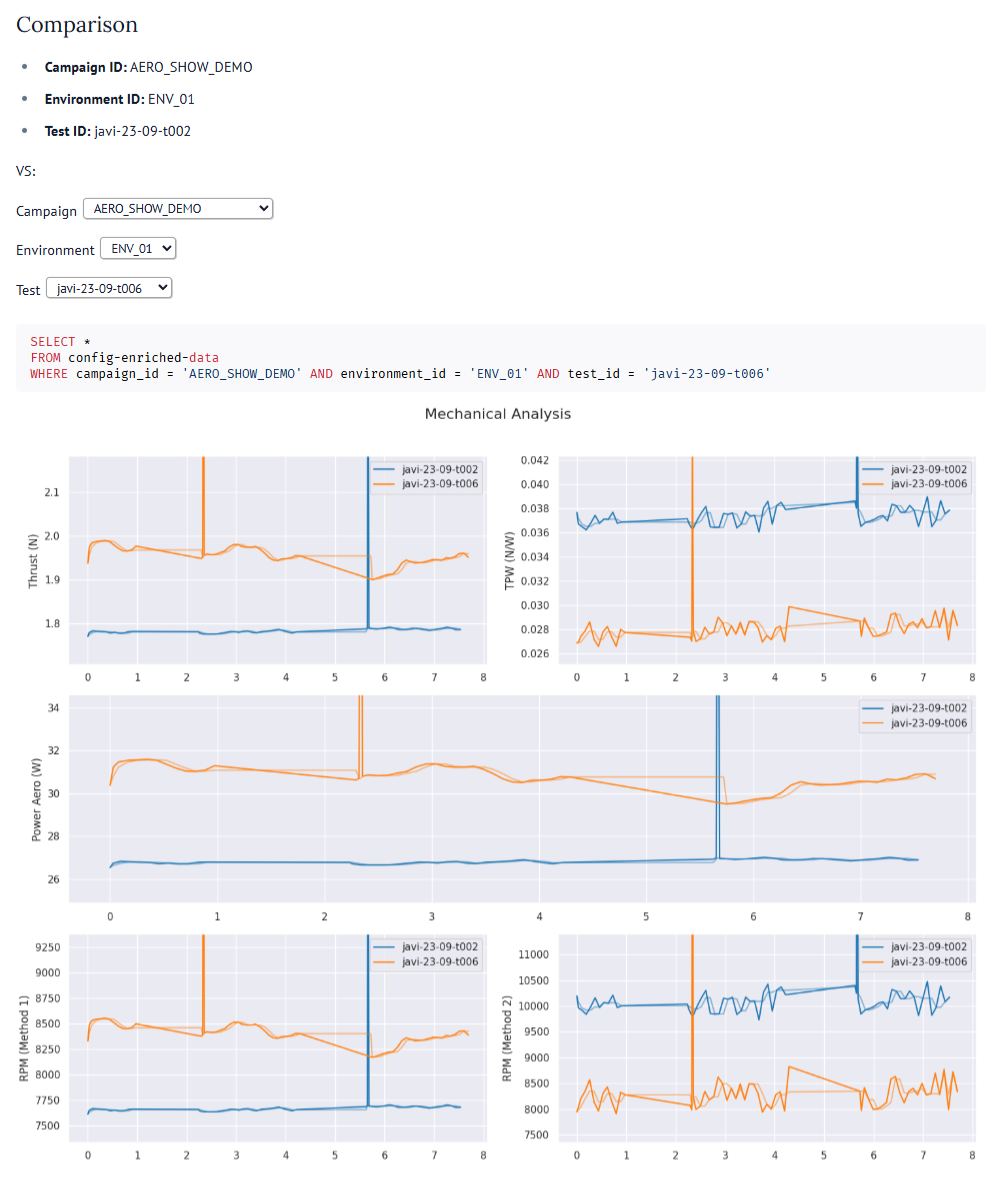
The beauty of this notebook format is that even a non-technical stakeholder can use it, by changing the values in the dropdowns. It acts as a report template that is accessible via a web page, and is a huge improvement on those fixed non-interactive reports that engineers might typically attach as a Word document in an email.
This allows us to produce a report which allows stakeholders to see that the new configuration from test t006 gives us the 11% performance boost in thrust we were looking for (compared to test t002), However, it's a brute-force approach. It's dramatically less efficient, consuming 45% more power to get there. This will result in a significantly shorter flight time for the drone.
This kind of comparison is also possible directly from the Quix Test Manager where you can select multiple test runs and compare individual measurements across multiple runs.
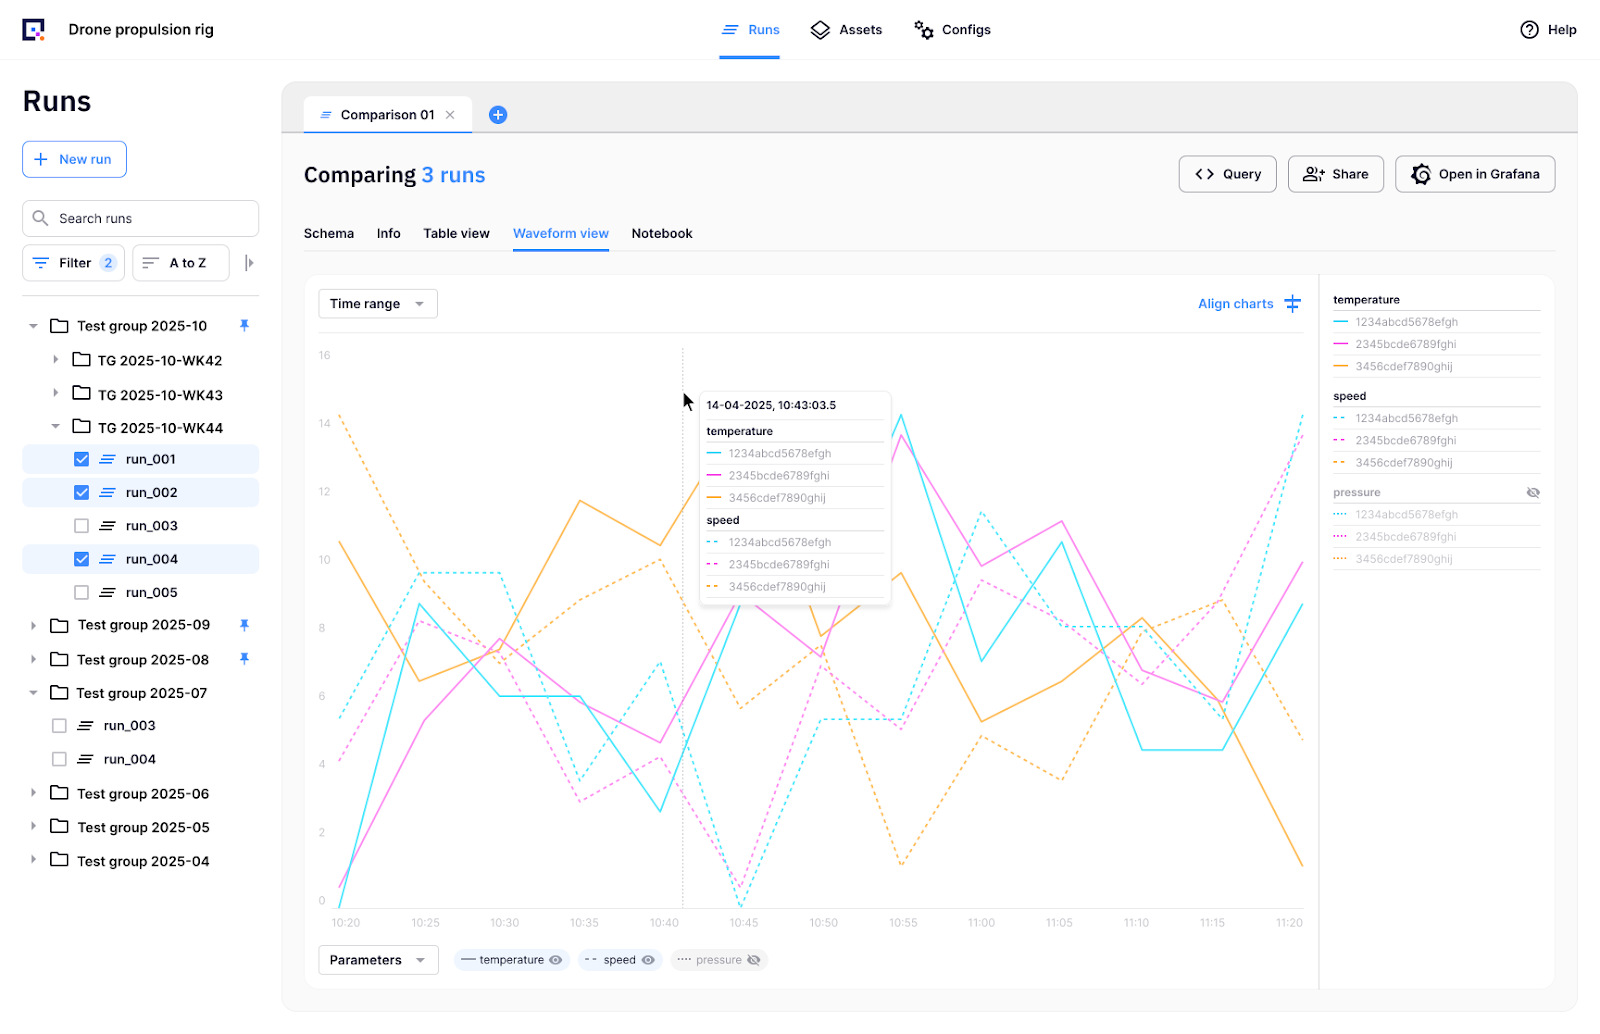
Both use The Quix Test Manager and the Marimo Notebook uses the same data API to retrieve consolidated test data from the Quix Data Lakehouse. You can use the same API to integrate your own tools too. For instance, if you prefer visualizing your data in a Jupyter Notebook or a Grafana Dashboard, it only takes a couple of lines of Python to integrate them.
Now that I’ve shown you the architecture piece-by-piece, here is the full diagram with all the components that I’ve discussed in this demo (and more).

What I haven't discussed here is the ability to “replay” data as though it is being retransmitted from the same test rig with the same timings. This allows you to tinker with downstream calculations without rerunning the whole test again. But that’s a subject for another article.
What we are trying to illustrate with this demo is the importance of centralizing data when attempting digital transformation in the industrial sector. Before I leave you, I want to zoom out a bit and touch on that aspect quickly.
A single data platform can rapidly accelerate your digital transformation
The speed of R&D is ultimately limited by how quickly your teams can get clear answers from their test data. Our propulsion rig demo was built to show a practical way to solve this. It is less about the rig itself and more illustrating how data moves in the Quix platform.
In many organizations, valuable domain experts spend an inordinate amount of time on the low-value work of data wrangling: finding files, correcting timestamps, and manually correlating results. A central data platform automates these essential but repetitive tasks. It handles the ingestion, normalization, and context-joining so that data is analytics-ready the moment it’s created. This allows your domain experts to focus on the high-value work they were hired for—analyzing results and making faster, more confident design decisions.
This is why many R&D organizations are currently trying to build their own centralized data platforms. Yet, anyone who has worked at a large enterprise can tell you: creating a custom, in-house solution, requires a significant investment in dedicated data and platform engineering, which diverts resources from core product development.
The alternative is to adopt a specialized third-party platform. This doesn't necessarily mean sacrificing flexibility for a rigid 'black box' though. A platform like Quix is designed to provide the resilient, scalable data plumbing as a foundation, while still empowering your engineers to write their own custom processing logic in familiar languages like Python.
Most companies know by now that centralizing engineering data is a must-have prerequisite for digital transformation. The strategic choice lies in how you do it: spend your engineering resources on building the data infrastructure, or let external experts provide it for you and use that infrastructure to build better products.
If you want to learn more, get in touch and I’ll walk you through the platform in more detail.
Last updated:
Oct 20, 2025
Check out the repo
Our Python client library is open source, and brings DataFrames and the Python ecosystem to stream processing.
Interested in Quix Cloud?
Take a look around and explore the features of our platform.
Interested in Quix Cloud?
Take a look around and explore the features of our platform.