.svg)
Tutorials
Nov 30, 2023
Analyze clickstream data in real time and trigger special offers based on user behavior
Analyze clickstream data in real time using Python. Trigger frontend events and show aggregations in a real-time dashboard using Quix, Streamlit and Redis Cloud


Clickstream data is great for understanding user behaviour. It's the raw material that tools like Google Analytics use to provide us with a myriad of aggregations and user-friendly reports. But what if you could aggregate the data yourself and get all your reports in real time rather than waiting for a third-party provider to process them in batches?
What’s more, what if you could personalize your website based on patterns that you detect in the data without using an expensive proprietary solution. We have a project template that helps you do just that. To build, deploy and run the project, you’ll use Quix—a tool to develop and run event streaming applications. Our demo version of this project also uses Redpanda Cloud as a message broker, but it’s not compulsory to have a Redpanda Cloud account to follow the tutorial.
To give you a taster, here are a couple of screenshots from the demo version of the template along with links to fully-functional demonstrations.
|
Demo Real-time Analytics Dashboard |
Demo Webshop Frontend |
|
|
|
|
https://streamlit-dashboard-demo-clickstreamanalysis-prod.deployments.quix.io/ |
https://demo-webshop-frontend-demo-clickstreamanalysis-prod.deployments.quix.io/ |

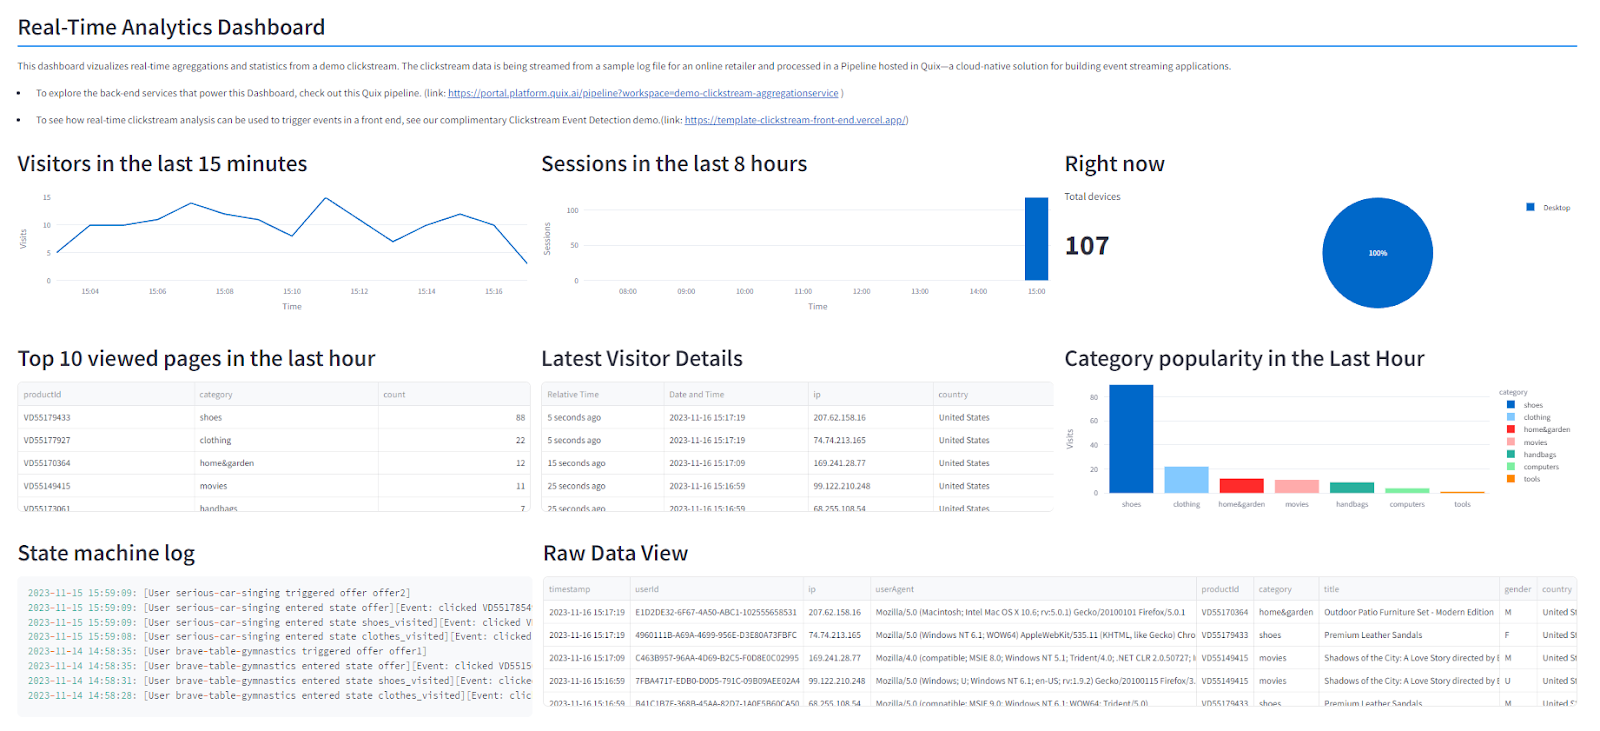
Demo Real-time Analytics Dashboard
This demo shows you how to display real-time aggregations in a Dashboard.
- The real-time metrics dashboard runs in Streamlit and contains similar metrics to what you might find on Googles own Google Analytics Realtime report except you have control over the aggregation algorithms.
- It’s powered by a log file that was collected from an online retailer, just over 114k entries collected over over 15 days.
- The log is being continuously replayed within Quix to simulate a real-time clickstream.
- The aggregations are continuously written to a Redis database and the dashboard reads the data directly from Redis while refreshing every second or so.
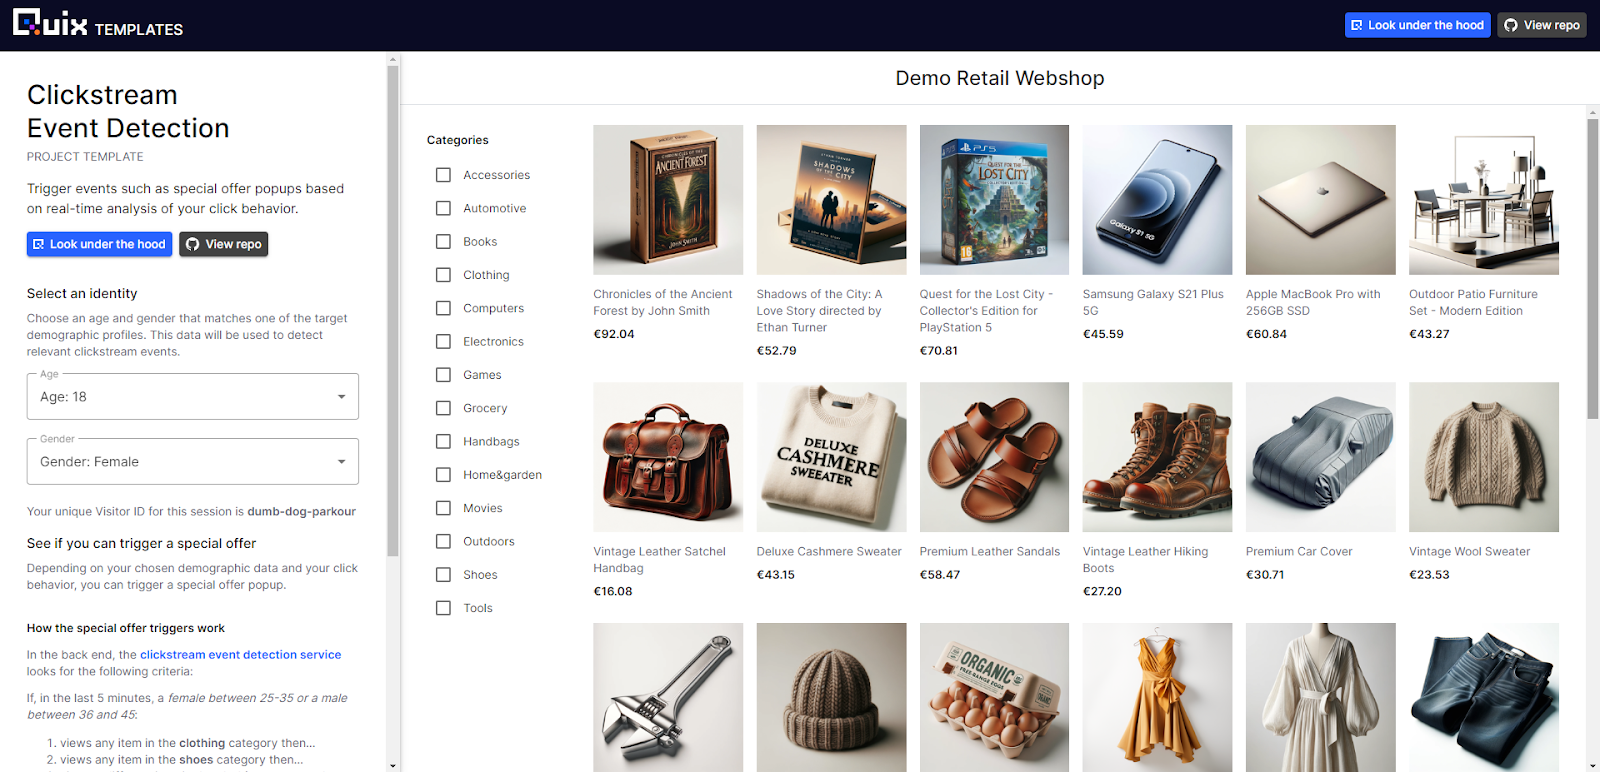
Demo Webshop Frontend
This demo shows you how to trigger events in a frontend based on real-time clickstream analysis.
- Personalization events are triggered when a target user views specific pages in a certain sequence.
- Once the sequence is completed, a “special offer” event is triggered in the back end and a popup is displayed.
This logic works in tandem with 1st party data collected by the retailer about their registered customers (only age and gender). - The special offers only trigger for visitors who match the target demographics defined in the detection algorithm.
- You can try out the event detection yourself by entering an age and gender combination that falls within the target range—thus “simulating” a target user.
- If you want to see how it works in the back end, you can click “look under the hood”.
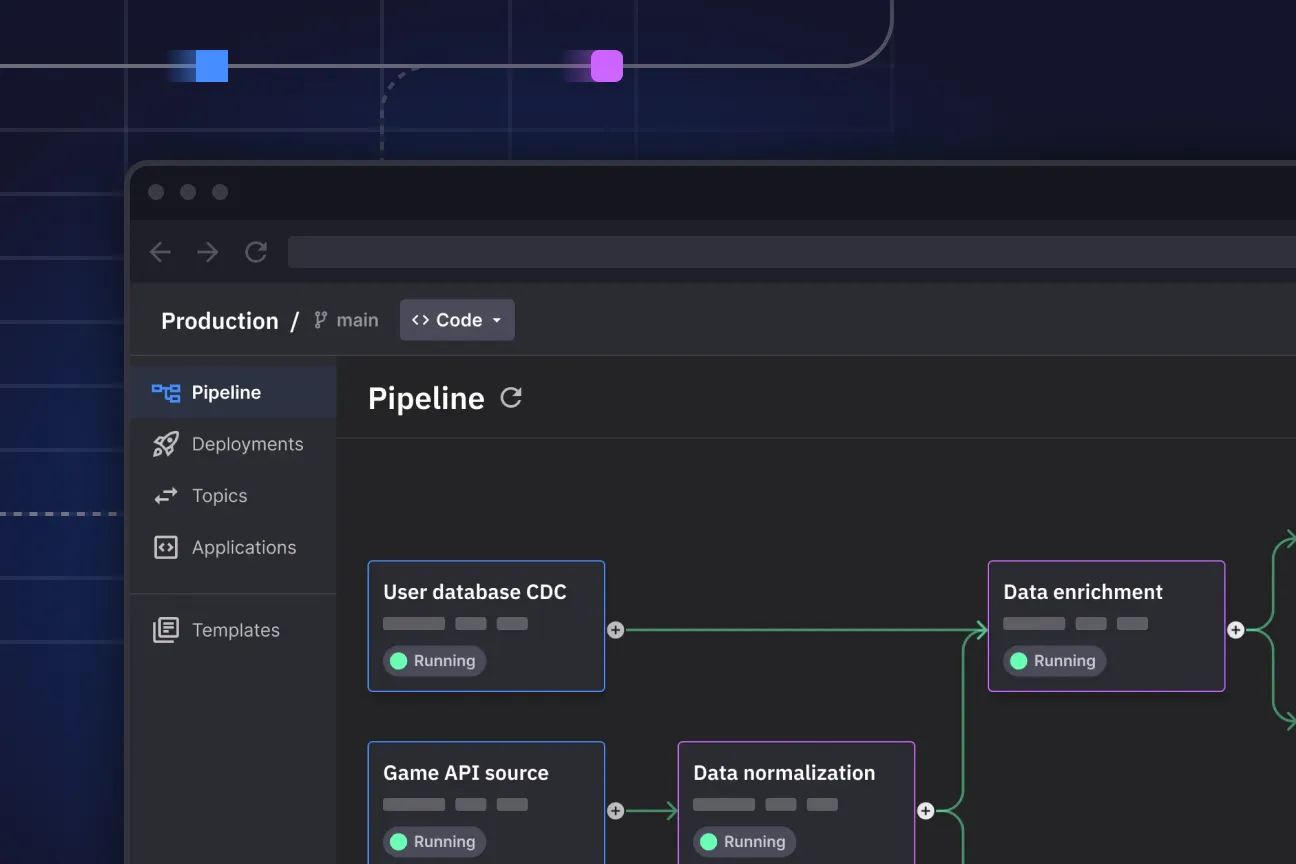
There, you’ll see the Pipeline page which shows you the running services and how data flows between them.
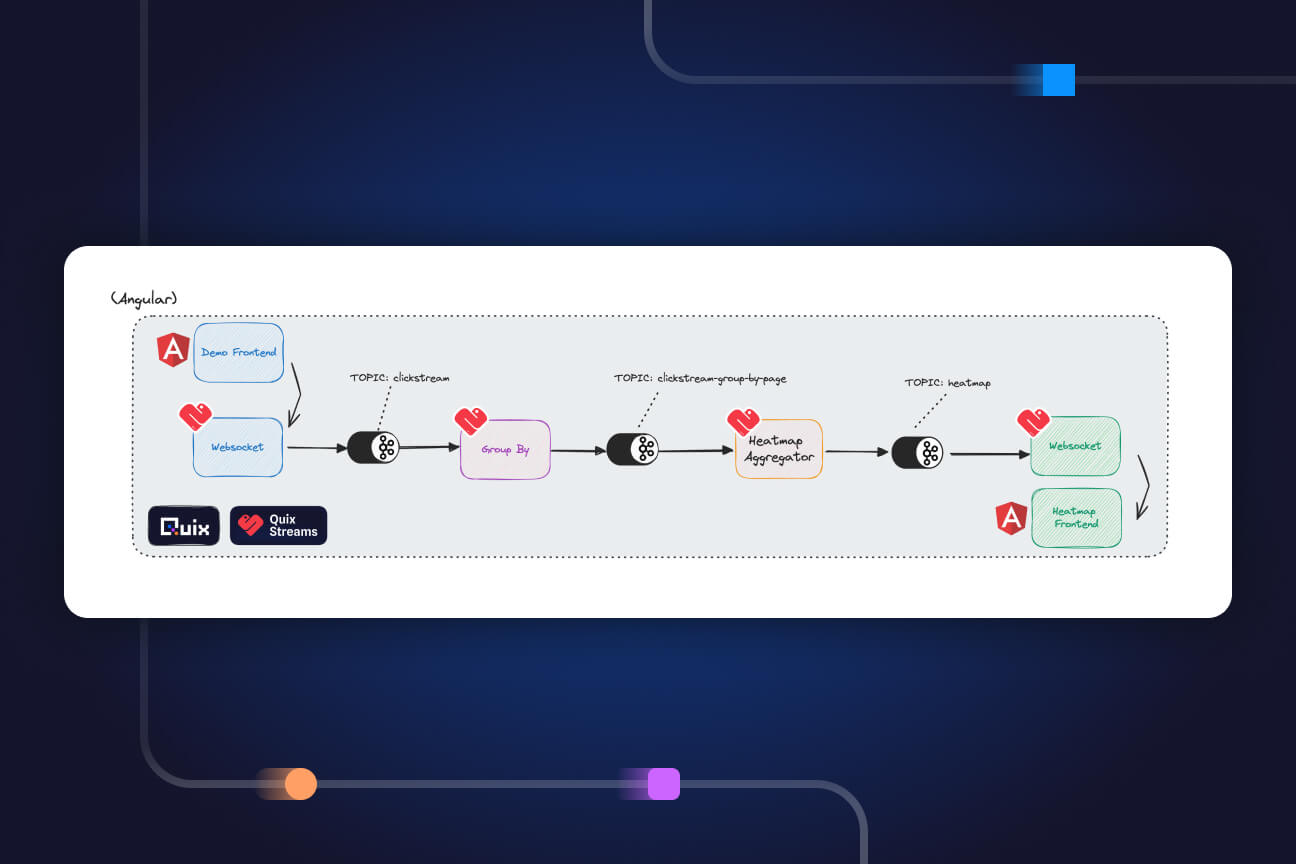
Back end architecture
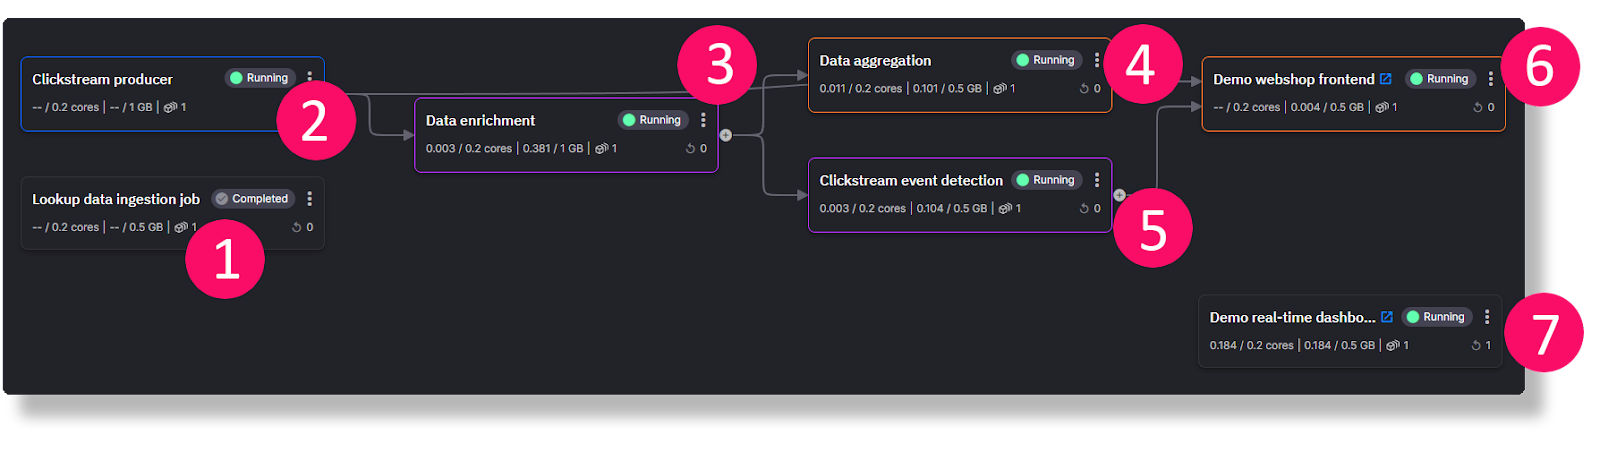
The following diagram shows how data flows from the back end to the two front-end services in the top-right and bottom-right corners.

In the case of the Demo Webshop, your page views are also sent back to the back end for event detection — but we’ll get into more details about these services in a minute.
The best way to understand how this project works is to create a copy of the project yourself and play around with the logic.
To make a copy of the project, you’ll need to fork the GitHub repo and follow a few steps in the Quix portal. I’ll get to the detail steps in a minute, but first, you’ll need:
- a free Quix account — if you haven’t created one yet, you can sign up now (you can do it in a few clicks with an existing Google, GitHub or Microsoft account).
- a GitHub account.
- a free Redis Cloud account.
The demo uses Redis Cloud to store state for the various services such as running totals and user demographics—signing up only takes a few clicks.
Getting your own copy of the project
There are a few major steps to getting your own copy of the project:
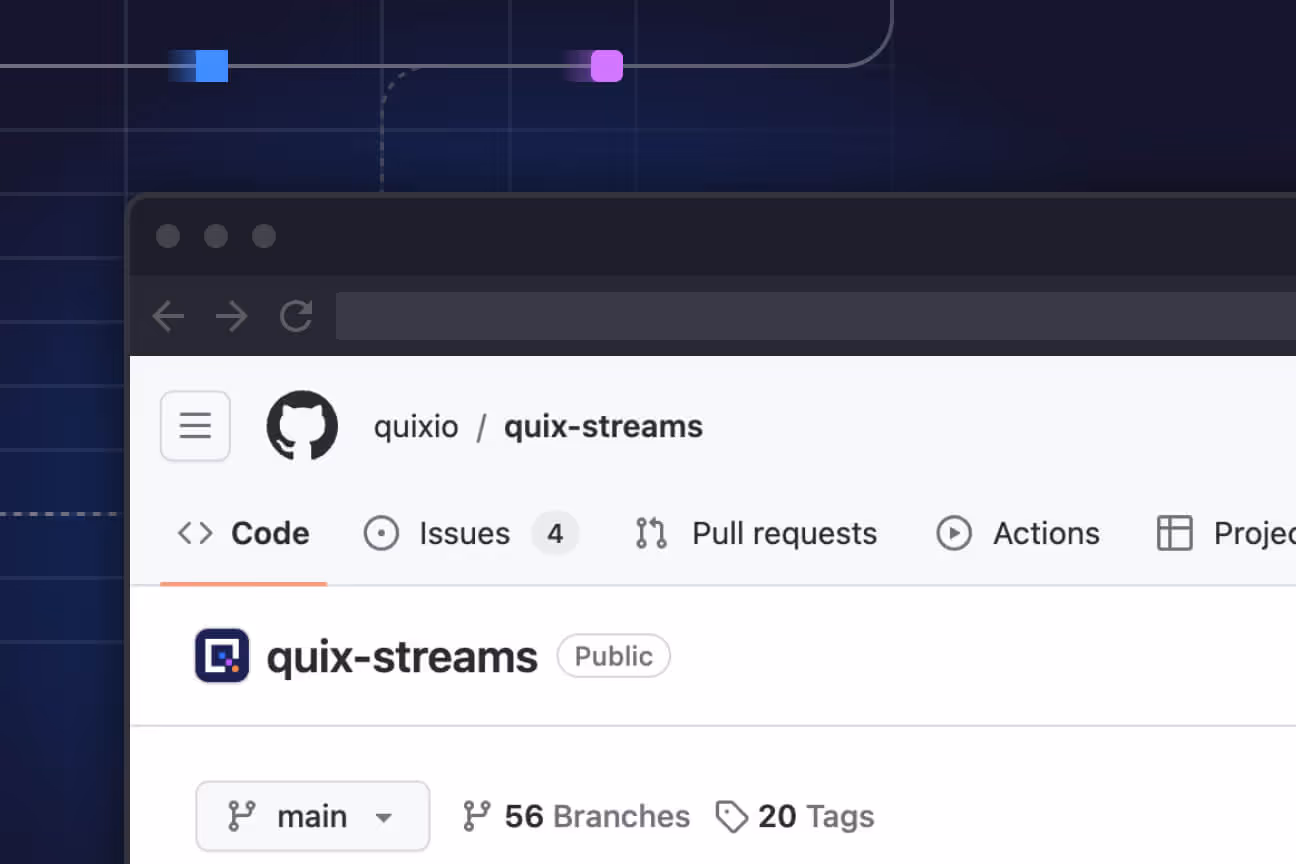
- Fork our clickstream template repository from GitHub.
This will make it easy for you to customize your version of the project but still benefit from upstream improvements.
- Create a project in Quix Cloud, create a new development environment and link it to your fork
This will allow you to run and update the application in Quix Cloud under your own account.
- Update the credentials for the Webshop frontend and Redis Cloud
App secrets such as API keys and database credentials are not transferred into project copies so you’ll need to add these yourself.
After you have the basics set up, we’ll dive into the code and look at how you can adapt it.
Forking the repository
To get a handle on the code, let’s first fork the clickstream template demo repository. Why fork rather than clone? Because, later you’ll be bringing that code into your own Quix environment and using a fork is the easiest way to keep your environment synchronized. You’ll also be able to get any upstream changes we make to the project template.
If you already have a GitHub account with lots of repos, you might want to create a specific Git user for this project. Later you’ll be giving Quix SSH access to the repository and having a separate user is a good way to ensure that Quix does not have more access than it should.
- In your web browser, log in to GitHub and open the Fork page for the clickstream template repository.
- Adjust the repo name if you like, and click Create Fork.
Creating a new development environment in Quix
Before you can create an environment in Quix, you first need to create a project. During the project creation wizard, you’ll then be asked to add an initial environment. You can add more environments later once you get the hang of things.
To create a project and connect an environment to your forked repo, follow these steps:
- Open Quix and create a new project.
- If you have an existing Quix account, log in and click + New project.
- If don’t have a Quix account yet, create an account and, when prompted, choose the Advanced 5-click project creation wizard.
- When prompted for a project name, enter “Clickstream Tutorial” (or something similar) and select Connect to your own Git repo.
- On the next screen, you should see some instructions on how to add the Quix SSH key to your repo—follow those instructions.
Adding this key enables Quix to automatically synchronize your repo with the Quix environment.

- On the next screen, you’ll be asked to create an environment—environments enable you to deploy code from different branches in parallel.
Enter ‘tutorial’ for the environment name and select the ‘tutorial ‘ branch from your forked repo.
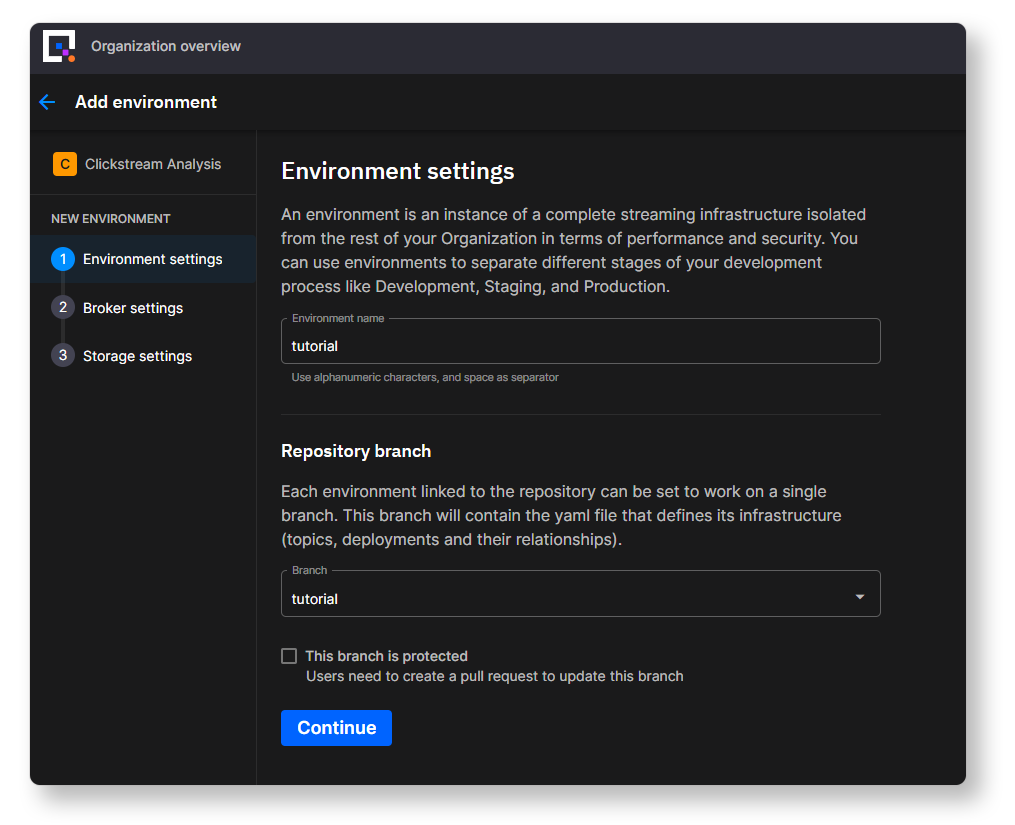
If you want to use this repo in production it’s advisable to set the branch as protected so that others don’t commit directly to the main branch and are required to use standard Git review procedures.
- Continue through the next steps in the project creation wizard.
- The wizard will ask you which message broker you want to use.
The original version of the project uses Redpanda Cloud as a message broker.
- If you want to use Redpanda Cloud too, you’ll need to have an account first—in which case you would select the Redpanda option and enter your credentials. If you don’t have a Redpanda Cloud account yet, open the sign up page to register for a free trial. Make sure that the user you create there has permission to create topics.
- Otherwise, if you just want to get started quickly, you also can stick with the default Quix managed broker.
- Continue through the next steps in the project creation wizard and keep the default storage settings.
- If it’s not open already, navigate to the Pipeline page.
You'll see a warning that your Quix environment is out of sync with the source repository (since the environment starts empty).

- At this stage you might see the deployment names show up with dotted borders around them, indicating that the deployments have been configured but not yet provisioned.
- Click the Sync environment button to pull the latest code from your forked GitHub repo and provision the deployments.
Note, the sync process is bidirectional: if you commit and push some changes to your repo from your local machine, Quix will automatically pull those changes. And likewise, if you commit some changes within the Quix IDE, it automatically will push those changes back to your GitHub repo too.
Hopefully the sync was successful. If it worked, you should see all your deployments get provisioned on the Pipeline page. The deployment panels should now have solid borders rather than dotted borders. They don’t start automatically though. You need to start them manually after you add the required application credentials.
For example, many services need to connect to Redis Cloud, and they will fail if you try to start them before you’ve configured your Redis Cloud credentials—but don’t worry, we’ll get to that in a minute.
First, let’s take a look at how the project is structured.
Looking under the hood
When you open the Pipeline page in Quix, you’ll see a visualization of how the different back end services are interconnected.
Each service writes to a topic which the next service then reads from. The topics are thus the “glue” that connects the services together and are represented as lines leading from one service to the next. If you mouse over a line, you’ll see the name of the connecting topic provided as a tooltip.
For this tutorial, I won't spend too much time going over the source code of each service, but you’ll find a brief description and links to more information in the following reference table.
Back end component reference
If you click any of the below component names, you'll be taken to actual service in Quix (running in a read-only environment).
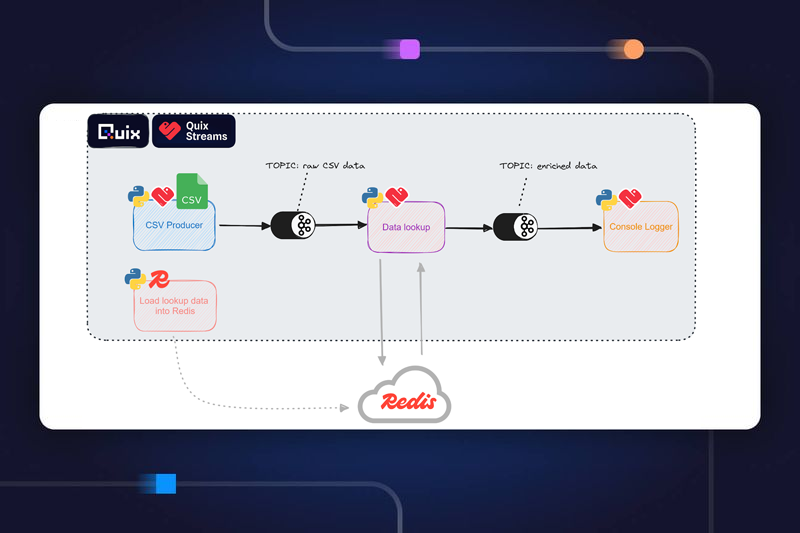
The lookup data contains basic user details such as gender and birthday as well as product IDs and their assigned product categories. The user details were collected when customers registered with the online retailer. There are around 38,000 entries which need to be loaded into Redis from a JSON file. Once these details are in Redis they can be used to enrich a real-time clickstream.
The ingestion code is deployed as a simple Job that runs once then completes.
This service simulates a real clickstream. It takes a raw log file and uses the original timestamps to stream the data over a similar timeframe and a similar pace (approximately 2 weeks albeit sped up slightly). This clickstream data is then written to the “click-data” topic.
This service reads from the ‘click data’ topic and enriches the raw messages with basic demographic data about the visitor (age, gender). The lookup is is performed on the Redis database that was populated in #1, and the visitor ID is used as the lookup key. If the visitor is recognized as a returning customer, their age and gender is appended to the relevant message and written to the topic 'enriched-click-data’.
There is also a lookup performed on the product ID to get the relevant product category.
This service reads data from the 'enriched-click-data' topic, performs various aggregations such as most popular retail categories in the last hour and then writes the results to a Redis database. The real-time dashboard (built in Streamlit) can then periodically retrieve these updated aggregations from Redis.
5) CLICKSTREAM EVENT DETECTION
This service also reads from the 'enriched-click-data' topic, but checks for a specific pattern in the clickstream data and emits a special offer event when the target pattern is detected. These special offer events are written to the ‘special-offers’ topic
This service runs a simple web server that hosts a real-time dashboard. This dashboard is built using Streamlit and displays various aggregations which it pulls from Redis every second or so.
This service runs a simple web server that hosts a demo retail webshop. It’s a very simple frontend built using Angular and displays several fake products with categories that match the retail categories found in the raw clickstream data. It also demonstrates how to exchange data with Quix using the SignalR typescript library. It listens for events coming from the ‘special-offers’ topic and triggers a special offer popup to the visitor when a matching event is detected.
cumentation and Source code
NOTE: This front end is designed to run in Vercel as an alternative deployment option. If you have a Vercel account, you can point Vercel to the Clickstream Template GitHub repo and enter the required environment variables.
In this tutorial, I want to focus on showing you how to customize the project for your own requirements.
Customizing the project
The first step to customizing the project is adding your own app secrets. For example, you’ll need your own bearerToken so that the Webshop frontend can connect to the Quix backend. You’ll also need to set up your own database in Redis Cloud (which only takes a few minutes) and use your specific Redis credentials.
Why are we using Redis Cloud? It's a valid question since Quix has its own methods to store state. However, in Quix state cannot be shared between different services (only replicas of the same service). It's intended to help a restarted service resume from where it left off rather than act as a general data store.
This template also uses Redis because it’s extremely fast and allows us to perform data lookups without slowing down the whole application. It also allows us to easily share data with external services running outside of Quix, such as dashboards running in Streamlit Cloud. And lastly, you can easily inspect the contents of the state with visual tools such as RedisInsight.
Note: You could theoretically run Redis within Quix too, but right now, it’s a little tricky to set up. If you just want to try Quix out, it’s much easier to get up and running with Redis Cloud.
Adding the required secrets
Let’s start with the bearer token. Any front end needs to use one of the Quix APIs to pull data. Before it can use the API, the front end must first authenticate itself using a bearer token. In this project, the Demo Webshop frontend needs to write data to the ‘click-data’ topic and read data from the ‘special-offers’ topic. To allow the Demo Webshop to authenticate with the Quix API, you’ll create a Personal Access Token (PAT) that you can configure as the bearerToken.
Getting a personal access token
Here’s how you get a personal access token in Quix.
- Open your profile menu on the top-right, and select Personal Access Tokens.
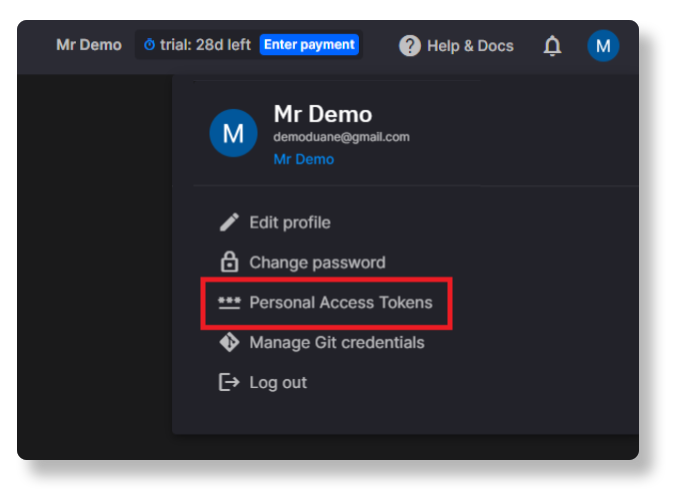
- In the dialog that appears, click Generate token, fill in the form, then copy and paste your personal access token to notepad or any other temporary storage location—you’ll need it for the next step.
Configuring the bearerToken as an application secret
You can now enter the PAT as a value for a new app secret called ‘bearerToken’.
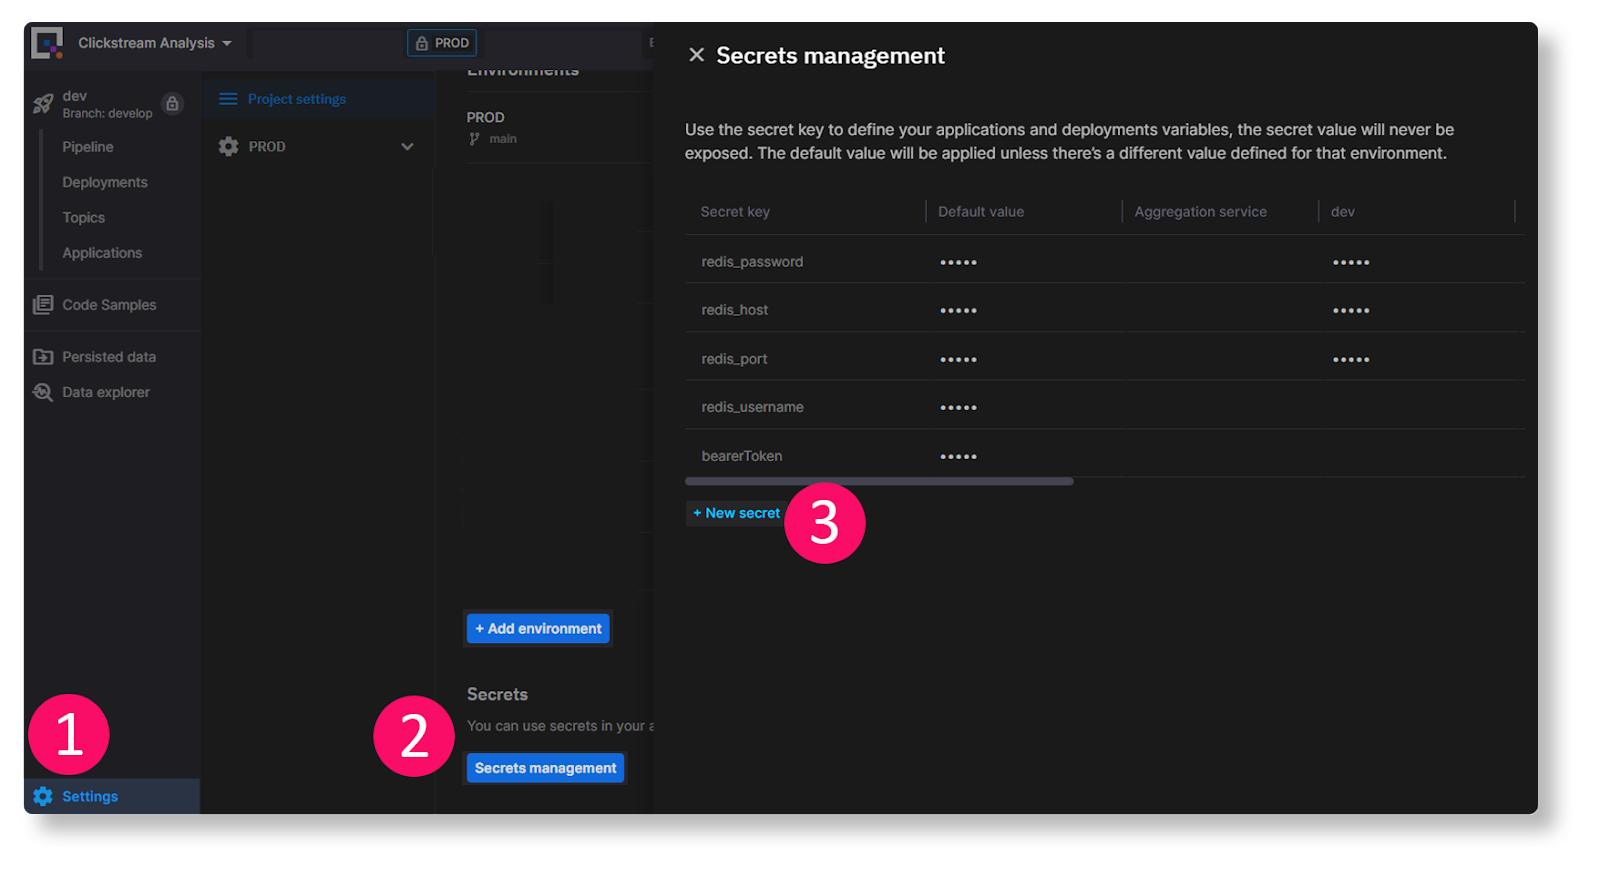
To add an app secret, follow these steps:
- Click the Settings button [1], then click Secrets management [2].
- In the panel that appears, click + New secret [3], and enter “bearerToken” as the Secret key.
- In the “Default” and “Tutorial” columns, paste your personal access token that you created in the previous step as the value in each cell.
Adding your own app secrets to store the Redis Cloud credentials
Repeat the same process above for the Redis credentials.
To connect to Redis, you need to add the following keys as app secrets:
Once you have added your Redis Cloud credentials you can start the lookup data ingestion job and the other services that need to connect to Redis Cloud:
- Clickstream event detection (for each visitor, log the state transitions to Redis)
- Data enrichment (lookup product categories and user details from Redis)
- Data aggregation (continuously write aggregation results to Redis)
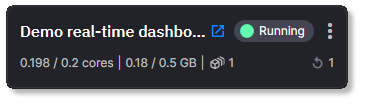
- Demo real-time dashboard (periodically read aggregation results from Redis)
Start all the remaining services and wait for all services to display a “running” status before proceeding to the next steps (except the lookup data ingestion which is a “run once” job).
Check the Real-time Dashboard
- You can open the Streamlit Dashboard by locating the Streamlit service and clicking the little blue launch
 icon.
icon.
You should see your own copy of the Streamlit Dashboard which shows the same real-time aggregations that were visible in the template demonstration.
For the sake of convenience, we’ve configured the Streamlit app to run within the Quix environment, but if you’d prefer to have it run in Streamlit Cloud, we’ve made it easy to transfer the code there.
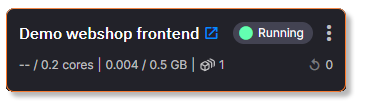
Check the Demo Webshop Frontend
- The process is very similar for the interactive personalization demo. On the "Demo webshop frontend" service, click the blue launch icon to open the demo webshop.
The demo webshop is designed to show you an extremely rudimentary method of personalizing a frontend in real-time by listening for a click pattern and showing a targeted special offer. In a production scenario, you might replace our very basic algorithm with a machine learning model that detects potentially high converting visitors. Or you might provide real-time recommendations based on what the visitor has viewed in their current session.
In any case, the inputs and the outputs are the same: Clickstream data in, derived events out. This frontend thus serves as a template for how to adapt to these derived events in real-time.
To get a feel for how it works, open the demo webshop and follow the instructions in the sidebar.
Did you trigger a special offer? I hope so. If it didn’t, try checking your browser console for any connection issues. Otherwise, read on because we’ll get into more detail about how the state tracking works.
Changing the special offer matching logic
There are many ways in which you could customize this project but let's start with something simple—changing the personalization logic.
Right now “Clickstream event detection” listens for cases where the target demographic looks at a clothes page, a shoes page, and then another clothes page that is different from the first one.
We could summarize it like so: Clothes ->Shoes ->Clothes->OFFER!
The event detection works by using a specific state machine that tracks a user’s progress through the states that lead to a special offer. The transitions are summarized in the following diagram.
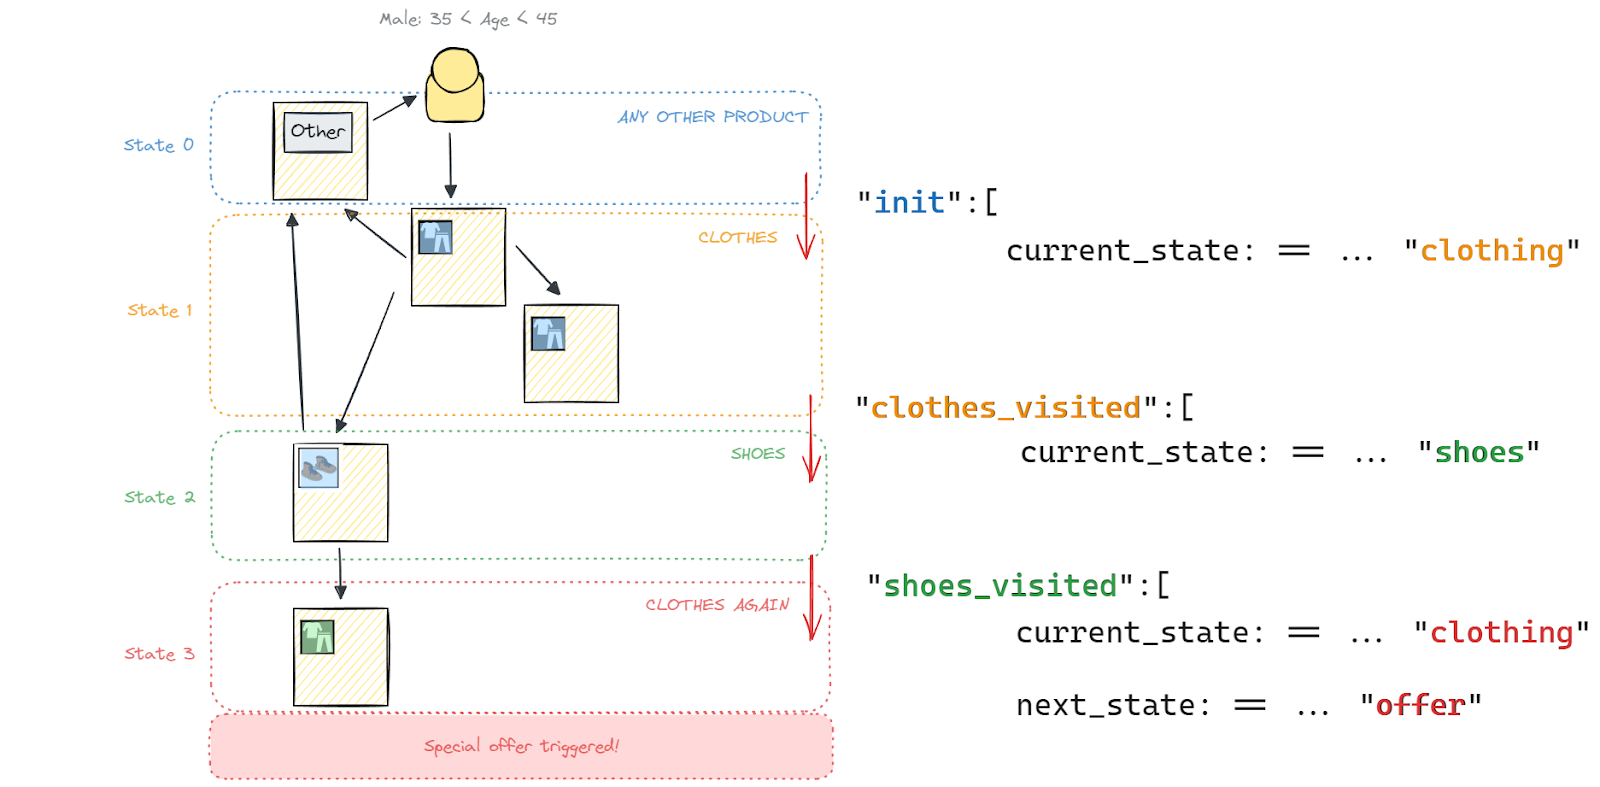
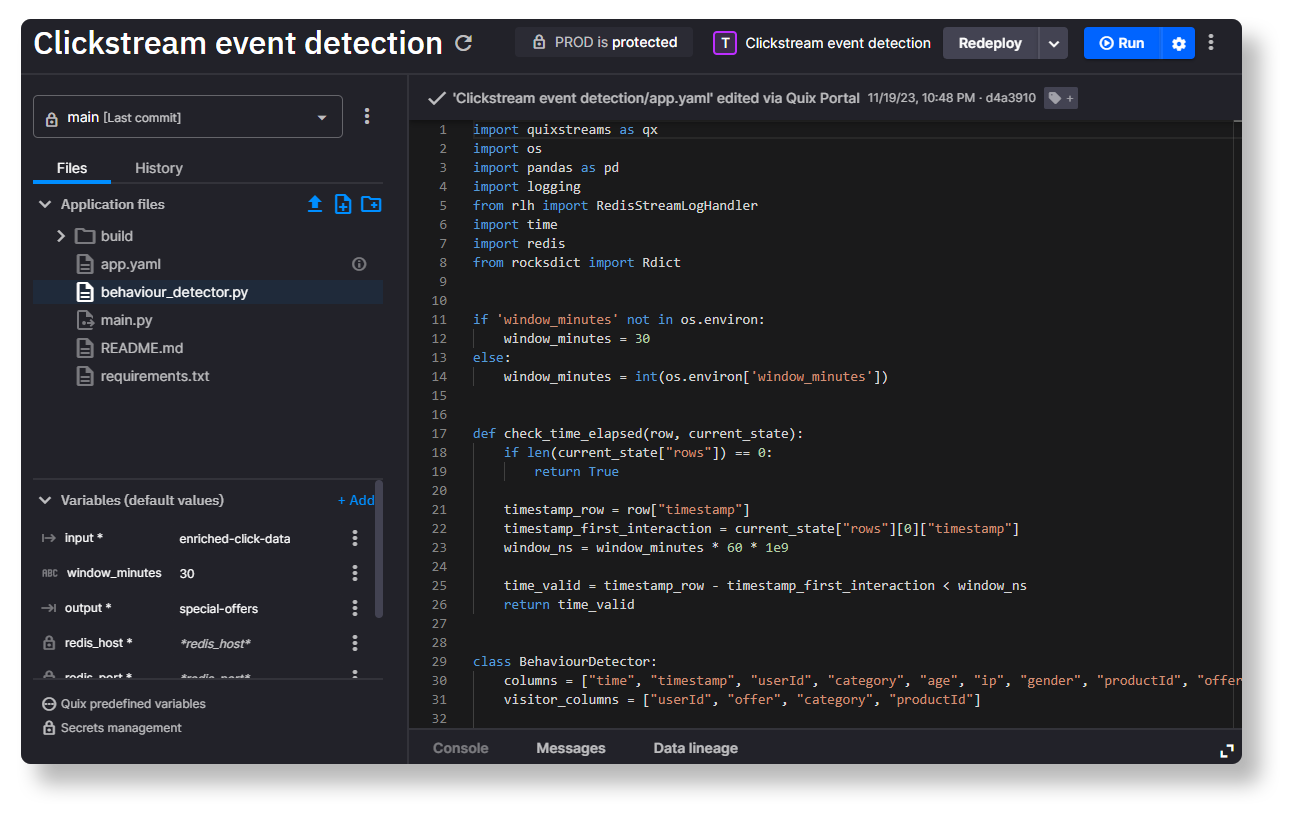
And here is an excerpt from the full source code which provides you with a bit of extra detail on the matching conditions.
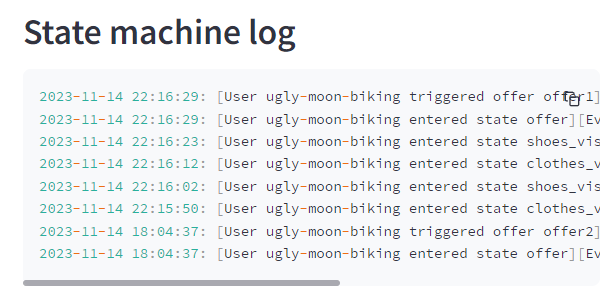
To make it easier to debug the state machine, we’ve included the debug panel on the real-time stats dashboard so that you can see what state the system thinks you’re in.
Now it’s time to get creative.
Suppose that too many users are getting the special offer and our shop is going broke. Why not make the pattern a little more complicated so that we don’t expose the special offer to as many users?
Let’s change it from:
Clothes ->Shoes ->Clothes->OFFER!
To:
Clothes ->Shoes ->Clothes->Shoes->Shoes->OFFER!
Now the visitor has to view three pages in the shoes category. And while we’re at it, let's make sure each “shoes” view is for a distinct product. In other words, the offer will fail to trigger if the visitor returns to a shoes product that they’re already seen.
To add these transitions, you would need to modify the transitions dictionary and add a couple of new transitions. The following code shows the state machine with the new transitions applied:
As you can see, I’ve added the following transitions:
- clothes_visited_2: checks that the user has departed the second “clothes” page and directly afterwards, opened a shoes page (current_state == "shoes") while ensuring it’s not a shoe that they viewed in one of the previous steps.
- shoes_visited_2: checks that the user has departed the second “shoes” page and directly afterwards, opened a third shoes page (current_state == "shoes") while again ensuring it’s not a shoe that they viewed in one of previous steps.
Let’s update the service with this new code:
- In the Quix IDE (Applications page -> Clickstream event detection -> behavior_detector.py) replace the old transitions dictionary with the one that has the additional transitions.
- Click Commit to save your changes.
Once you’ve committed the changes, it’s a good idea to tag your most recent revision so that it’s easier to tell what version of the code you want a deployment to use.
- Tag the commit by clicking the tag icon
 and give it a name…something like “updatingStateMachine”.
Now redeploy the service.
- To redeploy the service, open the deployment dropdown on the top right, and select “Edit existing deployment” then click “Redeploy”.
- In the deployment settings dialog, select the tag that you just created so that it’s clearer what change the deployment is using.

Navigate back to the Pipeline page where you should see a loading indicator on the “Clickstream event detection” deployment.
Once the Clickstream event detection service is running again, try out your new behavior detection pattern.
Open the Demo Webshop and open product pages according to the new sequence “Clothes ->Shoes ->Clothes->Shoes->Shoes->OFFER”. To make sure that state is being tracked correctly, keep an eye on the state machine log in the Real-time Dashboard.
Hopefully the new pattern worked and you see another special offer. Obviously this isn’t a particularly realistic use case, but this is a tutorial rather than a showcase so it helps to keep things simple. As I mentioned previously, you might end up using a machine learning model or a more sophisticated algorithm to detect events in real time.
But it doesn’t matter if it’s a basic state machine or a complex ML model, either option can run as a Python-based service in Quix. And either option can leverage our native quixstreams library to ingest data from Kafka (or Kafka-like message brokers) as Pandas dataframes. Thus, the beauty of Quix is that any Python-savvy data scientist can create the algorithm or ML model without too much refactoring required for a developer to implement in Quix—no Python to Java conversion required.
Ingesting “real” clickstream data into Quix
Testing with an old log file is all well and good, but you probably came here to see how you could adapt it to your own clickstream data.
Sadly, there's no easy way to show you how to do this because everyone's tech stack and app structure is different—but I can give you a few pointers:
- If you use Snowplow to collect first-party customer data , you can leverage our Snowplow connector to ingest data via AWS Kinesis Firehose.
- If you use Google Analytics, it might not be feasible to do real-time event detection, but you can ingest raw event data from GA4 into BigQuery which can then be picked up by Quix using Big Query change data capture.
— You can also get near-real time data by using GA4’s streaming export feature.
— But why wouldn’t you just aggregate data in BigQuery? Well, it can be a lot cheaper and faster to aggregate the data on the fly (in Quix) and write only the aggregations back into Big Query for long-term storage. - If you use another database such as PostGres to ingest and store raw event data, you can use the Quix PostGres CDC connector to pick up those changes and perform real-time aggregations on the data as it comes in.
— Again, this can be cheaper and faster than running huge batch aggregation queries. - You can also circumvent third party services altogether and send events natively from your web application as we have done with our demo Webshop.
—For example, if you check the source code for the product-details page component you can see that the ngOnInit() function (triggered on page load) calls the sendData() function which sends the required event data (via the quixService component).
—You can code up your front end with similar event calls while using the SignalR library to send those events to Quix.
On that last point, if you would like a more in depth tutorial on how to customize the front end of this project template — let me know in the Quix community Slack. In this tutorial, I’ve assumed that most readers are interested in customizing the back end. However, I am also considering a front-end sequel to this tutorial where I’d show you how to add click events to the “Add to Cart” button and send those click events to a new topic specifically for on-page interactions. If that sounds like something you want to learn, let your voice be heard!
Conclusion
I hope this tutorial and template has helped to demystify some of the complexity around real-time clickstream processing. And I hope it inspired you to build something that you could use in production. If it did, I’d love to hear about it. As usual, if you had any issues, be sure to post a question in our community forum and one of us will get right on to it.
Many tutorials out there make it seem daunting to build and deploy a streaming processing application. Setting up the required tools (like Kafka, Apache Flink, or event ksqlDB) in not something you can get done in your lunch break. That’s why we created Quix, to take most of that heavy lifting away, so that you can focus on the processing logic. And let's not forget that Python has a fantastic ecosystem of libraries for manipulating data and integrating machine learning models, so it makes sense to leverage that ecosystem for stream processing. This means you can write processing logic without having to learn a DSL(Domain Specific Language) or manage UDFs (User Defined Functions). And there’s the Quix Streams Python library which helps you consume, produce and process data at extremely performant speeds (despite being pure Python).
- To learn more Quix Streams, check out the relevant section in the Quix documentation.
- To see more project template demos, why try out our Chat sentiment analysis demo which uses the Hugging Face Transformers library to perform live sentiment analysis on chat messages or our Computer vision demo which uses YOLOv8 to count vehicles.
Last updated:
Jun 18, 2025
Check out the repo
Our Python client library is open source, and brings DataFrames and the Python ecosystem to stream processing.
Interested in Quix Cloud?
Take a look around and explore the features of our platform.
Interested in Quix Cloud?
Take a look around and explore the features of our platform.