Build a CDC pipeline with the Quix SQL Server connector
Create a CDC pipeline and publish data to Kafka topics in just a few minutes with our open source SQL Server connector.

CDC or Change data capture is the process of recognising and reacting to data changing in a source system. Our SQL Server CDC connector is a simple way to build data processing pipelines that can react to changes in your SQL database tables.
It’s built with Python and the code is open source, see it here. It currently works with Microsoft SQL databases, but can easily be forked to work with other SQL technologies.
How to build a SQL CDC stream
Our implementation simply reads the contents of the target table, comparing the configured timestamp column with the configured time delta. The resulting records are streamed to a Kafka topic.
This process repeats itself per the configuration. However, on subsequent reads from the table the connector only considers data that has arrived since the last read.
If there are columns containing sensitive data you can optionally remove these from the data set being sent to Quix using the ‘columns_to_drop’ setting and if required you can rename columns with the ‘columns_to_rename’ setting.
When using the column renaming functionality it should be noted that the columns in the source tables aren't affected. The data streaming to Kafka will simply have the new column name rather than the original.
All of the configurable options can be seen below and are configured per table being ‘watched’.
Environment variables
The code sample uses the following environment variables:
- output: The output topic for the captured data.
- driver: The driver required to access your database. e.g. \{/opt/microsoft/msodbcsql18/lib64/libmsodbcsql-18.1.so.1.1\}
- server: The server address.
- userid: The user ID.
- password: The password.
- database: The database name.
- table_name: The table to monitor.
- last_modified_column: The column holding the last modified or update date and time. e.g. timestamp
- time_delta: The amount of time in the past to look for data. It should be in this format. 0,0,0,0,0 These are seconds, minutes, hours, days, weeks. 30,1,0,0,0 therefore this is 1 minute and 30 seconds.
- offset_is_utc: True or False depending on whether the last_modified_column is in UTC.
- columns_to_drop: Comma separated list of columns to exclude from data copied from the target table to Quix.
- columns_to_rename: Columns to rename while streaming to Quix. This must be valid json e.g. \{"DB COLUMN NAME":"QUIX_COLUMN_NAME"\} or \{"source_1":"dest_1", "source_2":"dest_2"\}
- poll_interval_seconds: How often to check for new data in the source table.
Note that the columns to rename and columns to drop settings do not affect the source database. They are used to modify the data being streamed into Quix.
Driver and columns to rename should include { and } and the start and end of their values and these MUST be escaped with a \ e.g. `\{setting value\}`
Build a SQL CDC stream
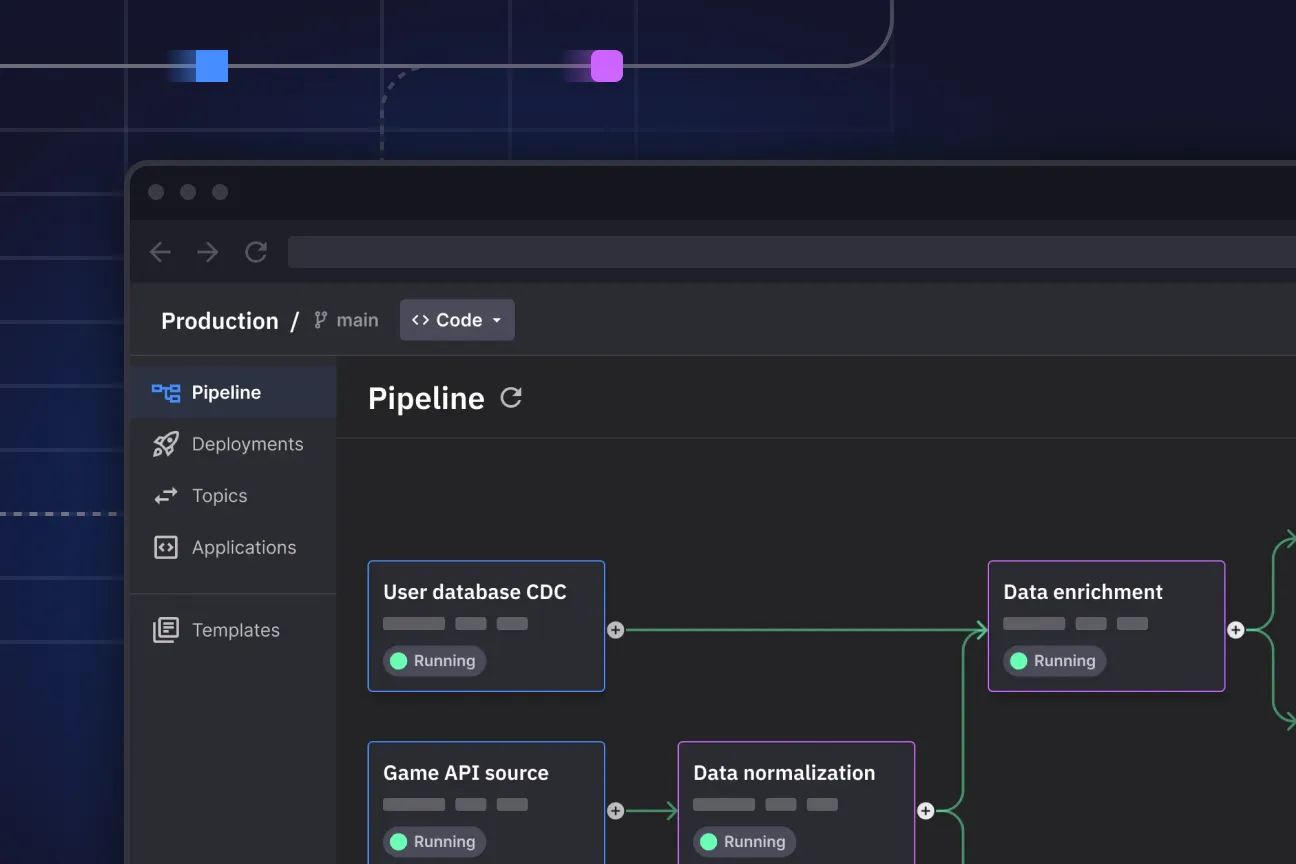
Quix provides a fully managed platform where you can deploy this SQL CDC connector and publish data to Kafka topics in just a few minutes. To build your CDC pipeline, sign-up for a free account and configure a source connector. Search for the “SQL CDC” connector in our library and deploy it. You can also sync the data to a warehouse using our destination connectors, and why not try processing your data in motion with a Python transformation.
Haven't got an account? Sign up now! It's free!
Find out more about Quix here, or if you'd like to chat with us about this article or anything related to Python or real time data, please drop us a line on our Slack community, The Stream.
Check out the repo
Our Python client library is open source, and brings DataFrames and the Python ecosystem to stream processing.
Interested in Quix Cloud?
Take a look around and explore the features of our platform.
Interested in Quix Cloud?
Take a look around and explore the features of our platform.

.svg)


