.svg)
Streamline test rig data ingestion with unified pipeline architecture
When your battery testing facility generates 50GB of data daily across multiple test rigs, or your drone flight tests produce thousands of sensor readings per second, collecting the data is just the beginning. The real challenge? Making it immediately useful for your R&D teams. The Test Rig Ingestion Pipeline Reference Architecture provides a battle-tested solution for centralizing diverse test data streams into a unified, queryable platform that accelerates your design-validation cycle.
About the reference architecture
The Test Rig Ingestion Pipeline Reference Architecture is a pre-configured data processing pipeline designed specifically for R&D organizations managing multiple test environments. This Quix Framework reference architecture handles real-time data ingestion from various test equipment protocols, normalizes disparate data formats, and stores everything in a high-performance time series database with built-in visualization capabilities.
Unlike generic data pipelines, this reference architecture addresses the unique challenges of test rig environments: intermittent connectivity, diverse data formats, high-frequency sensor data, and the need for immediate visualization of test results. The pipeline can be deployed and customized within hours rather than months, eliminating the extended development cycles that typically plague custom solutions.
The problem
Modern electro-mechanical systems generate staggering volumes of test data. A single rocket engine test run can produce 2TB of sensor data in minutes. Electric vehicle battery testing facilities run hundreds of concurrent charge-discharge cycles, each generating continuous telemetry streams. HVAC system validation requires coordinating data from thermal sensors, pressure transducers, and flow meters across multiple test chambers.
Here's where it gets messy. Desktop-based workflows force engineers to manually hunt down data from individual test rigs, often using proprietary software that refuses to play nicely with other systems. Data sits trapped in isolated silos, making it impossible to correlate results across different test phases or dig up insights from previous programs. When a critical design issue surfaces during testing, engineers waste precious time tracking down historical data instead of solving the actual problem.
The coordination challenge gets even more complex when test rigs speak different languages (aka use different protocols). Your vibration test equipment outputs data via MQTT, while your environmental chamber uses HTTP REST APIs. That legacy load testing hardware in the corner? Serial communication only! Each protocol needs different handling, buffering, and error recovery strategies, complexity that small digitization teams struggle to manage alongside everything else on their plates.
The result? Delayed insights, missed correlations, and validation cycles that drag on longer than they should. Without centralized data access, distributed teams can't collaborate effectively on complex projects, and critical knowledge stays locked in individual engineers' heads instead of being shared across the organization.
The solution
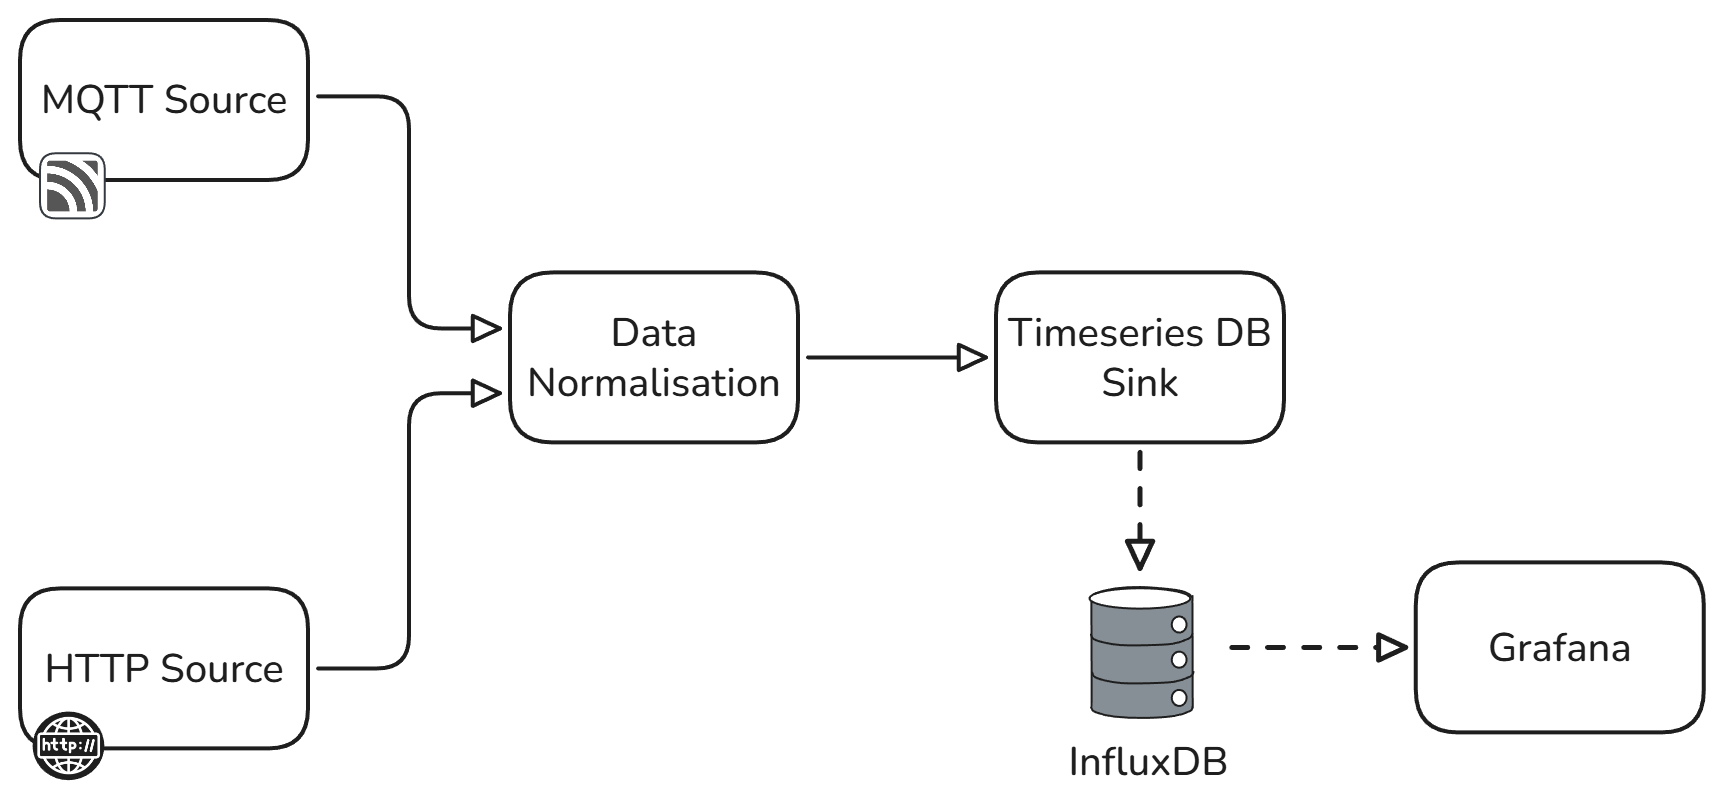
The Test Rig Ingestion Pipeline Reference Architecture eliminates data silos by providing a unified ingestion layer that handles multiple communication protocols simultaneously. Built on the Quix Framework, the architecture consists of four core components that work together to transform raw test data into actionable insights while enabling seamless collaboration across distributed R&D teams.
The pipeline begins with flexible source connectors that handle both MQTT and HTTP data streams. MQTT sources are ideal for high-frequency sensor data from modern test equipment, while HTTP sources accommodate REST API endpoints from web-enabled test systems. Additional sources such as OPC-UA or CSV can be added easily to integrate with other systems. This multi-protocol approach ensures compatibility with both legacy and modern test infrastructure without requiring expensive equipment replacements.
All incoming data flows through a centralized data normalization component that standardizes timestamps, units, and data formats regardless of source protocol. This normalization layer handles the complexity of converting different timestamp formats, scaling sensor values, and applying calibration coefficients automatically. The result is a consistent data schema that enables cross-system analysis and comparison, eliminating the manual data preparation that typically consumes hours of engineering time.
The normalized data streams directly into a time series database optimized for high-throughput sensor data. This database provides the performance characteristics essential for test environments: microsecond timestamp resolution, compression ratios exceeding 90% for typical sensor data, and query response times under 100ms even for datasets spanning months of continuous testing. This performance enables real-time monitoring and historical analysis without the delays that plague file-based approaches.
Real-time visualization connects directly to the time series database, enabling engineers to monitor test progress, identify anomalies, and make data-driven decisions without waiting for post-processing. The visualization layer supports both real-time streaming dashboards and historical trend analysis, providing the flexibility needed for different phases of the validation process while enabling remote collaboration across distributed teams.
Key features of this reference architecture
Multi-protocol ingestion handles the reality of mixed test environments where equipment uses different communication standards. The architecture automatically manages connection pooling, retry logic, and buffering for each protocol type, ensuring reliable data collection even during network interruptions or equipment restarts. This reliability is crucial for maintaining test validity and avoiding costly re-runs.
Intelligent data normalization eliminates the manual effort typically required to align data from different sources. The normalization engine applies configurable transformation rules, handles unit conversions, and manages timestamp synchronization across systems with different clock sources. This automated processing cuts data preparation time from hours to minutes, freeing engineers to focus on analysis rather than data wrangling.
High-performance time series storage provides the scalability needed for intensive testing programs. The database efficiently handles burst data rates exceeding 1 million points per second while maintaining query performance for historical analysis. Automatic data compression and retention policies ensure storage costs remain manageable even for long-term testing programs spanning multiple product generations.
Real-time monitoring capabilities enable immediate response to test conditions and facilitate collaboration across distributed teams. Engineers can set up automated alerts for parameter thresholds, monitor test progress remotely, and identify issues before they impact test validity. The visualization layer supports both standard dashboard views and custom analysis workflows tailored to specific test procedures.
Extensible architecture allows the pipeline to grow with your testing needs without requiring complete rebuilds. Additional source connectors can be added for new equipment types, custom transformation logic can be inserted into the normalization flow, and multiple sink destinations can be configured for different data consumers. This flexibility ensures the architecture adapts to evolving test requirements while protecting your investment in existing infrastructure.
Centralized data access enables knowledge sharing and collaboration that desktop-based workflows cannot support. Historical data from previous programs becomes immediately accessible for comparison and analysis, while distributed teams can work with the same real-time data streams regardless of their physical location.
Code sample
The following example demonstrates how to configure the data normalization component for a typical battery testing scenario where voltage measurements arrive via MQTT and temperature readings come through HTTP endpoints:
from quix_streams import Application
from quix_streams.models import TopicConfig
import json

# Configure the normalization application
app = Application(
    broker_address="localhost:9092",
    consumer_group="test-rig-normalizer"
)

# Define input topics for different data sources
mqtt_topic = app.topic("mqtt-sensor-data", value_serializer="json")
http_topic = app.topic("http-sensor-data", value_serializer="json")

# Create normalized output topic
normalized_topic = app.topic("normalized-test-data", value_serializer="json")

# Normalization function for MQTT voltage data
def normalize_mqtt_data(message):
    data = json.loads(message.value)
    return {
        "timestamp": data["ts"] * 1000,      # Convert to milliseconds
        "test_id": data["test_session"],
        "parameter": "voltage",
        "value": float(data["voltage_v"]),
        "unit": "V",
        "source": "mqtt",
        "equipment_id": data["rig_id"]
    }

# Normalization function for HTTP temperature data
def normalize_http_data(message):
    data = json.loads(message.value)
    return {
        "timestamp": data["timestamp"],
        "test_id": data["session_id"],
        "parameter": "temperature",
        "value": float(data["temp_celsius"]),
        "unit": "°C",
        "source": "http",
        "equipment_id": data["chamber_id"]
    }

# Process MQTT stream
mqtt_stream = app.dataframe(mqtt_topic)
mqtt_normalized = mqtt_stream.apply(normalize_mqtt_data)
mqtt_normalized.to_topic(normalized_topic)

# Process HTTP stream
http_stream = app.dataframe(http_topic)
http_normalized = http_stream.apply(normalize_http_data)
http_normalized.to_topic(normalized_topic)

if __name__ == "__main__":
    app.run()
This code demonstrates how the normalization layer handles different data formats and protocols while producing a consistent output schema suitable for time series analysis and visualization.
Conclusion
The Test Rig Ingestion Pipeline Reference Architecture transforms fragmented test data collection into a unified, scalable system that actually accelerates R&D workflows while enabling real collaboration across distributed teams. By handling multiple protocols, automating data normalization, and providing real-time visualization, this architecture eliminates the manual processes and desktop limitations that slow down design validation cycles.
Organizations implementing this reference architecture typically see immediate benefits: reduced data preparation time, improved cross-system correlation capabilities, faster response to test anomalies, and better knowledge sharing across distributed teams. The centralized approach also enables better collaboration between distributed teams and provides the data foundation needed for advanced analytics and machine learning applications.
The architecture's extensible design ensures it can evolve with your testing needs, from adding new equipment types to scaling up for larger testing programs. Rather than building custom solutions from scratch or struggling with the limitations of desktop-based workflows, your team can focus on what matters most: using test data to drive better design decisions and accelerate product development.
Ready to modernize your test data infrastructure? Explore how centralized data platforms can transform your R&D workflows and eliminate the bottlenecks that slow down innovation cycles.
Using this template
This blueprint can be useful for the following use cases:
• R&D
• Test Chamber
• Test Run
• Simulation
• Digital Twin
Main project components
Technologies used

