Automating analytics with a stream processing platform
Here at Quix, we use … Quix! How we built a customer-centric user journey pipeline to automate real time analytics.

Our library is open source—support the project by starring the repo.
Alert: This post includes images of the Quix portal that are no longer accurate. We have updated images here.
Here at Quix, we use … Quix!
Let’s not call it “eating our own dog food” but “drinking our own champagne.” We are so confident in the productivity and scalability of the Quix platform that we are using it to build the platform — and we are moving fast.
Stream processing enables a wide variety of use cases across industries. Any project that benefits from processing live data can use it. So one of the operating systems we’re building with Quix is a real-time analytics environment that wraps user clickstreams and backend product event data into a singular view of each user.
The key business goal for this solution is that it must be scalable, extensible and user-centric. Today it serves to produce real-time Slack notifications for team motivation and customer support (like, “You just got a new user — hurrah!”) and daily funnel reports (such as daily aggregated signups, activations and active users). Tomorrow it has to be useful for real-time personalization use cases. This includes real-time interventions, such as when a user has technical problems and optimizing our underlying cloud infrastructure resources.
How to build customer-centric, real-time analytics
Stream processing is perfect for this hybrid real-time and batch analytics use case. With Quix, we built a stream processing pipeline for the real-time features (analyzing user activity and sending Slack notifications) and simultaneously clean and store data into the catalog for use in daily reporting and ad hoc analysis with Grafana.

This hybrid solution based on stream processing principles makes life much easier later. First, extending the real-time pipeline is straightforward by adding additional services for specific features, such as integrating them into a customer service dashboard. Second, because the data is cleaned, prepped and organized in-flight, it’s easier to build the daily reports and hook up the catalog to Grafana.
The catalog schema now matches the production schema, so our data scientists can easily explore the model in search of deeper insights like behavioral patterns — without wasting time cleaning and sorting data.
A considerable part of this capability comes from the Streaming Context feature in the Quix SDK. Let’s take a look.
Wrapping data into a customer journey stream
Quix provides context that lets us wrap data from different sources into a singular stream, with a defined start and end.
We wanted to use this Streaming Context feature to deliver customer centricity by wrapping all data from each user journey into an individual stream. In this case, clickstream data from the frontend is integrated with event stream and logs from our Kafka backend.

Why? Over time, this lets us build a deep understanding of how individuals use our product and allows us to build real-time personalization features to improve the user experience.
Streaming data from different sources
We wrote some custom Javascript using our Streaming Writer API to stream data from the frontend to a topic in Quix. The schema includes information on the browser like height and width dimensions and user interactions, including button clicks, page URL and visibility changes.
We then wrote a Kafka connector to stream data from our backend service bus (Kafka) to another topic in Quix. This schema contains the information from our backend services like API requests and responses, error messages and error codes.
The data are written using our parameterData and eventData formats, which result in a topic schema that is very easy to understand and use. Additionally, all data streamed is stored in this same schema, so any employee can enter our Portal Analytics workspace to review the raw data:
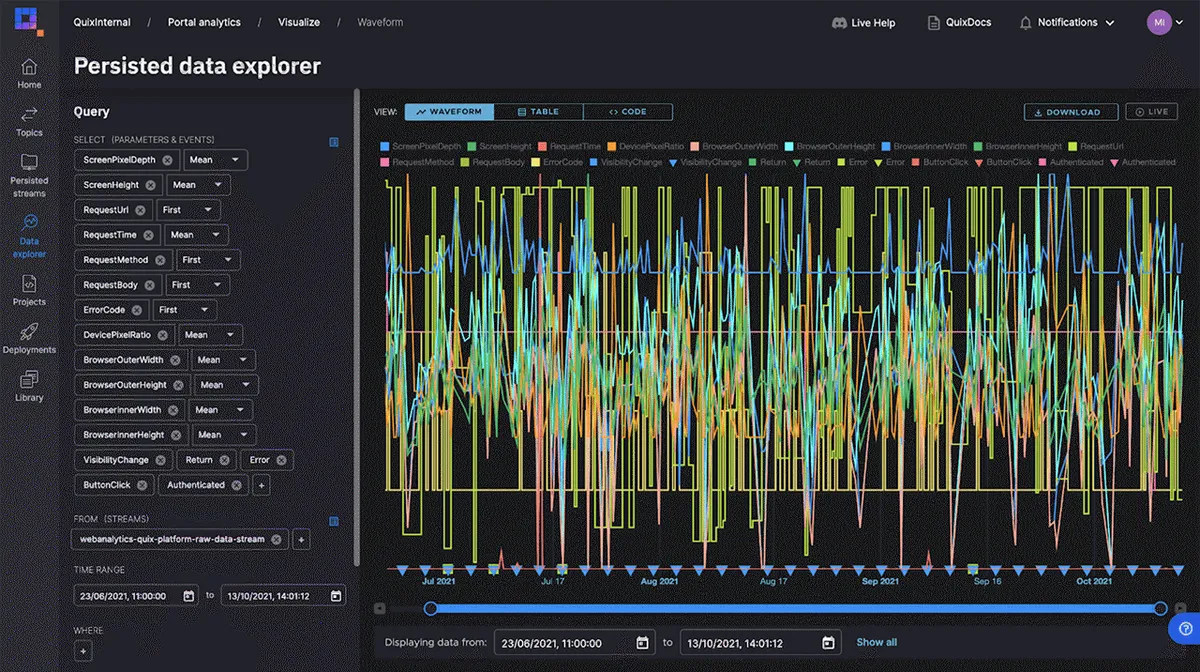
As you can see, the raw data is quite challenging to interpret, so we need some processing and automation to create useful information. Let’s do that next.
User Journey Mapping
Now that we have streaming data from the frontend and backend, we need to wrap it into our business context — one customer journey. We wrote a Python service to translate individual parameters and events into a stream, one for each user.
Individual requests, or a series of specific requests, might translate into higher-level actions, such as:
- An attempt to login
- Creating a new topic (topics are defined well in this post)
- Writing and running code
- Running a deployment

Here you can see how user journey mapping lets us view how a new user is onboarded to our product. In subsequent columns, you’ll see timestamps in the first column and their time-ordered events (authenticated, a project created, deployment started, etc.).
With this in place, we can now build event-driven automation. For example, we can send notifications to Slack when a new user signs up. If we see them having technical problems, we can intervene to give them a better user experience in real time while they are still using the product.
Building real-time, event-driven alerts
The Slack notification is a straightforward service that listens for the events in the customer journey stream (like deployment started and deployment completed) and sends notifications to Slack if the logic detects a problem, such as a longer-than-expected deployment. It also reads an error message event, such as a failed deployment.
Our implementation of this is basic at the moment, but my favorite alert is the Signup bot. It motivates the team to know that a new developer has seen potential in our project:

We see a lot of potential in real-time alerting to help us build a fantastic customer experience (more on that below). For now, though, our stream processing pipeline also serves to automate our daily reports and ad hoc analytics.
The advantages of using stream processing for data analytics
The big advantage of taking a stream processing approach to data analytics is that your data is cleaned and processed into a user-friendly business context before it lands in storage.
Read that again.
“The big advantage of taking a stream processing approach to data analytics is that your data is cleaned and processed into a user-friendly business context before it lands in storage.”
It sounds trivial, but processing the data before it sinks into a data lake is essential to use data successfully. The current “dump it and transform it” approach in the data industry costs data engineering teams 80% of their time. This has to change.
At McLaren, we would never dump data and transform it later. The race would be lost by the time someone got around to analyzing what the sensors were streaming. The waste of time in dump-transform-analyze is unthinkable in a high-performance environment.
Instead, we always go upstream to correct data quality issues at their source, working to guarantee quality data-in-flight — before it lands in storage.
Automating daily reports
With the data stored neatly, it’s easy to build an automated daily report.
Our first report aims to track the aggregated number of new users who have progressed (or not) through the onboarding funnel. We then send that report in PDF to a Slack channel called #portal-analytics.
The funnel looks like this:
- # new sign-ups
- # activated users (users who have completed a meaningful activity in the product)
- # active users (users who continue to complete meaningful activities)
- # inactive users (previously active users who have not been active in the past 15 days)
The immediate advantages of having these daily reports are:
- Specific action can be taken to address individual customer needs
- Wider dissemination of this data in a simple format improves understanding across the team. For example, if users are consistently stuck at one part of the process, we can develop better docs or content to support them.
Building the automated report
The report was built using a simple Python service deployed in Quix. Unlike the real-time pipeline, this service is not connected to the broker. Instead, it works as a standalone service deployment to:
- Query the data catalog to calculate the metrics for each stage in the funnel
- Write the query results into a new stream called Users by Activation Stage
- Query the new stream to generate a PDF report for each stage in the funnel
- Send a report for each stage in the funnel to Slack
Then it waits for 24 hours (from last time to first time) and starts the process again.
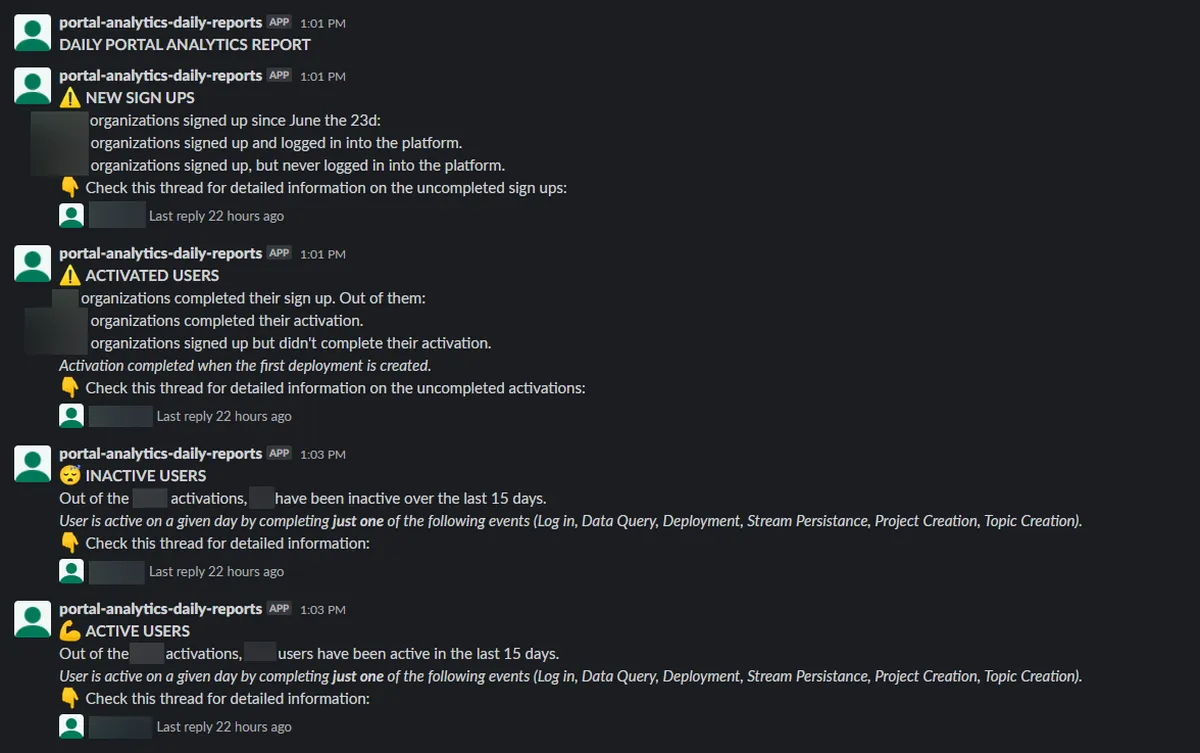
In the Slack channel above, you can see that each stage in the funnel is represented by its own message, each one having several replies, which is an individual report for each user journey stream.
Before this was in place, there was no accurate way to gauge how many users were in each state and whether their onboarding journeys faltered at a certain point.
Now we can see exactly what’s happening every day and target improvements to our product and onboarding journey to optimize conversion — we even query all of this data in Grafana where we can adjust the range from one day to all-time.
“These reports are now totally automated, so maintenance is essentially zero. And we can extend this to more use cases as we grow.”
These reports are now totally automated, so maintenance is essentially zero. And, with just a tiny amount of work, we can extend this to more use cases as we grow.
Taking advantage of stream processing analytics
Although these daily reports are beneficial for us, there are better tools for product analytics (check out PostHog — we love it!). So you might be thinking: why bother building analytics on a stream processing platform?
It’s the future possibilities that excite us. Remember the solution requirement was to be scalable, extensible and user-centric?
Now that we’re collecting data from different sources into a customer journey stream and have built it on a real-time pipeline, we can start to act on that data proactively and instantly.
“Our stream-processing-first solution was easy to build — it was developed in a matter of hours. But it has opened up a huge number of potential applications.”
Some of the things we’ll build as we scale include:
- Automating and customizing onboarding emails specifically for users (“Hey, we saw you’re streaming data from a car. Check out our forecasting model.”)
- Popping up a dialog to assist users if we recognize they are stuck
- Sending a tech support message if we see an error code
- Automatically sending emails to customers to remind them of an upcoming trial expiry. (Quix’s free trial currently doesn’t expire, doesn’t require a credit card, and comes with $240 per year in free Quix credit to get your PoC running.)
- Recommending when users should train ML models based on their deployment patterns
- Customizing UX based on users’ behavioral patterns (“Looks like you are a data scientist. Have you tried turbo mode?”)
- Presenting rewards to deeply engaged users
- Scheduling and automating our infrastructure based on demand for resources
Our stream-processing-first solution has opened up a huge number of potential applications in practice. And it was easy to build. This solution was developed in just a matter of hours.
The real power behind this use case is the Quix portal, which helps organizations analyze and act on data in real time, bring products to market faster, and avoid the massive costs of data infrastructure.
Ready to try it for yourself? Here’s the link to your free trial. If you have any questions, join us in our Slack community.
What’s a Rich Text element?
The rich text element allows you to create and format headings, paragraphs, blockquotes, images, and video all in one place instead of having to add and format them individually. Just double-click and easily create content.
Static and dynamic content editing
A rich text element can be used with static or dynamic content. For static content, just drop it into any page and begin editing. For dynamic content, add a rich text field to any collection and then connect a rich text element to that field in the settings panel. Voila!
How to customize formatting for each rich text
Headings, paragraphs, blockquotes, figures, images, and figure captions can all be styled after a class is added to the rich text element using the "When inside of" nested selector system.

Check out the repo
Our Python client library is open source, and brings DataFrames and the Python ecosystem to stream processing.

Peter Nagy is Head of Platform at Quix, where he leads the infrastructure team to ensure security and stability while building out Quix's features. He was previously a software engineer at McLaren, implementing improved remote stream processing for Formula One car data, and helped build their internal platform. Peter has been coding since childhood.
Related content

Exploring real-time and batch analytics for e-bike telemetry with Quix and AWS


Optimizing manufacturing efficiency with streaming data and ML

What you can do with the Quix SDK and why we developed it from scratch
